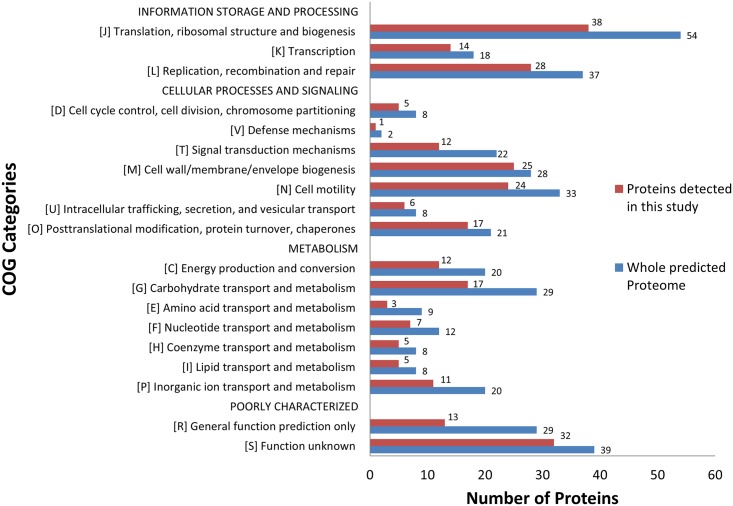
Fig 2. Bar Diagram depicting the distribution of the detected and undetected T. pallidum proteins distributed in 19 COG functional categories.
Blue bars represent MS detected proteins in this study. Red bars represent all predicted proteins in the T. pallidum proteome. The functional category was automatically determined for genes that could be placed in Clusters of Orthologous Groups (COGs). For genes with more than one COG category both categories were used.

