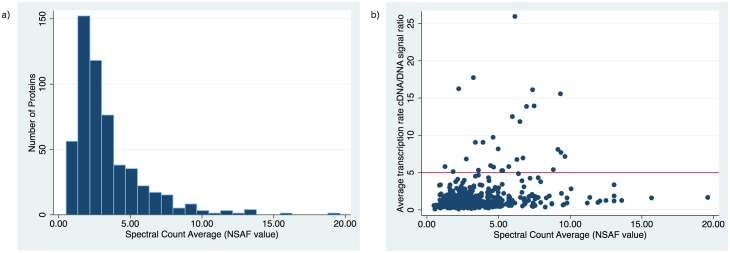
Fig 5. (a) Histogram depicting the distribution of detected T. pallidum proteins sorted according to their protein abundance amounts (Log expression NSAF values) (b) Scatter Plot of Microarray cDNA/DNA ratio signal versus NSAF spectral count average for all MS detected proteins.
Statistical analysis revealed no correlation between protein abundance and microarray data (Pearson’s correlation coefficient r = 0.26). Proteins not detected did not have a significantly lower microarray signal as calculated by a two-sample Wilcoxon rank-sum test (P = 0.5). Red line designates cutoff for ‘high abundant’ proteins (NSAF value > 5.0)

