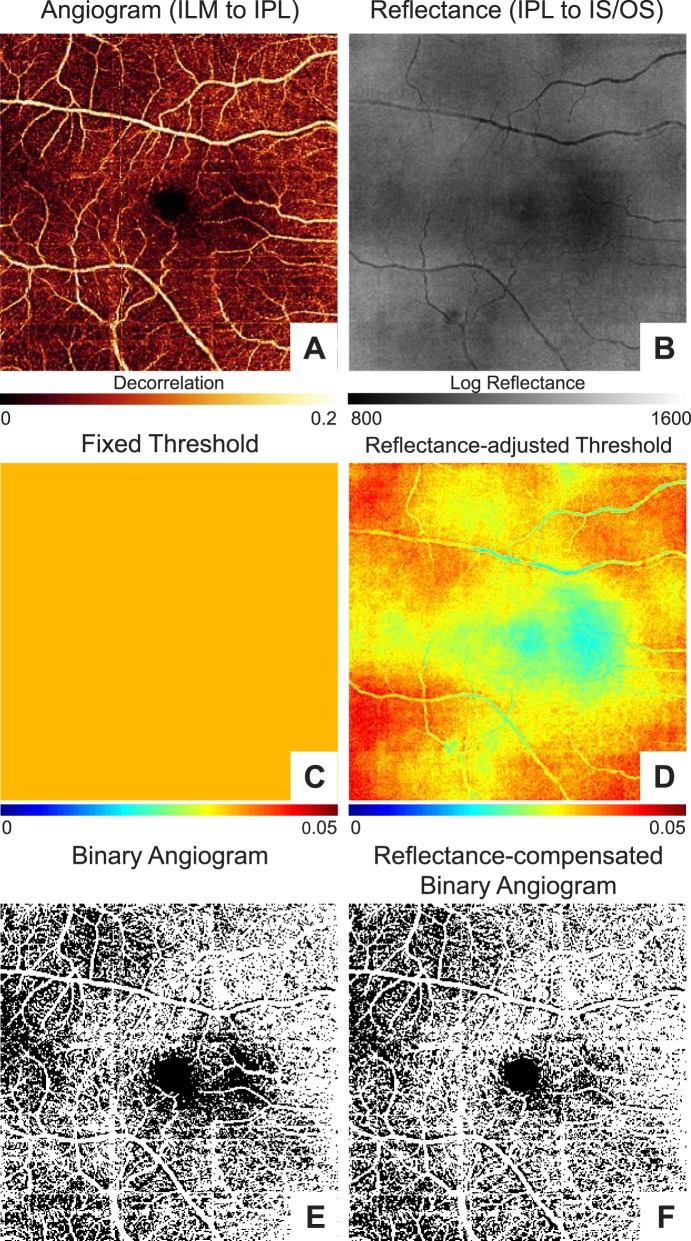
Figure 3.
An example of the macula in a right eye to show the improvement in vessel density uniformity using the reflectance-adjusted threshold compared to a fixed threshold. (A) En face angiogram generated by maximum flow projection in the superficial vascular complex defined as between the inner limiting membrane (ILM) and outer boundary of the inner plexiform layer (IPL). (B) En face reflectance image generated by the mean log reflectance of the slab between the outer boundaries of IPL and hyperreflective inner/outer segment (IS/OS) junction band. (C) Threshold map with a fixed value of 0.0347. (D) Reflectance-adjusted threshold map derived from the reflectance map shown in (B) and Equation 5. (E) Binarized image of (A) based on a fixed threshold for all pixels as shown in (C). (F) Binarized image of (A) based on the reflectance-adjusted threshold map in (D). Note the apparent nonperfusion defect in the region immediately to the right (nasal) of the fovea in (E) that was improved in (F), which compensated for the low reflectance in that area (B, D) likely due to a vitreous opacity. Vessel density is higher on the nasal (disc) side of the image; this is a normal pattern associated with the thicker nerve fiber layer around the optic disc.

