
Figure 5.
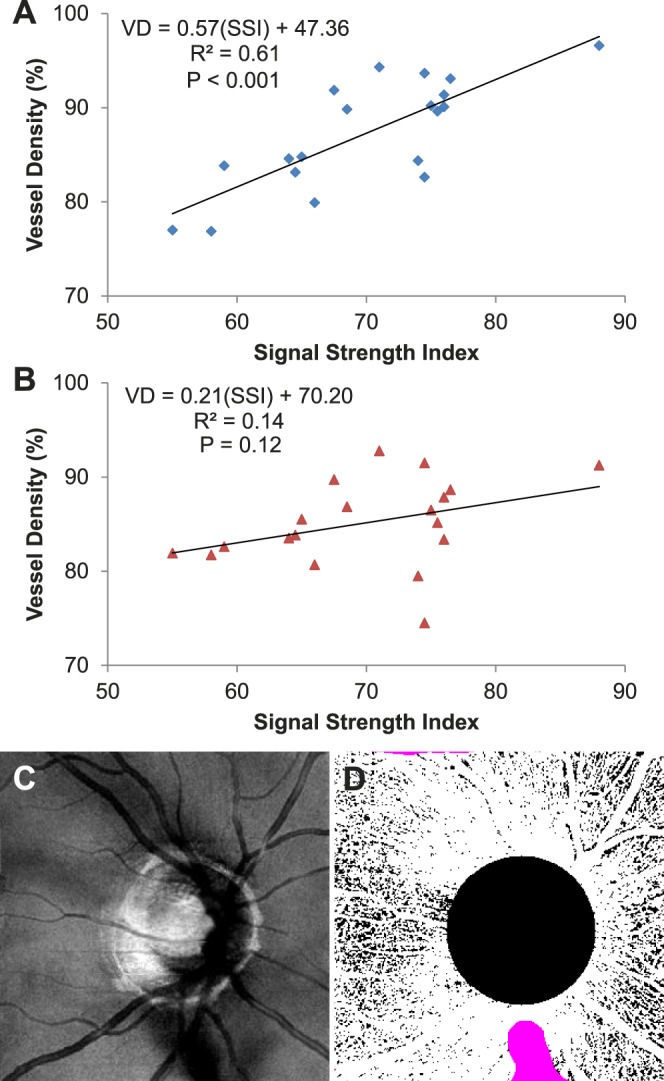
The linear relationship between signal strength index (SSI) and vessel density (VD) at the peripapillary region determined using a fixed threshold (A) was reduced with the reflectance-adjusted threshold (B). Each data point was the average of the two scans from a participant. Linear regression was used to fit the data. The fit equation, R2, and P values are shown. (C) En face reflectance image (IPL to IS/OS) of the scan with the highest percentage of invalid pixels (2.9%). (D) The corresponding reflectance-compensated binary angiogram with the invalid pixels in purple.