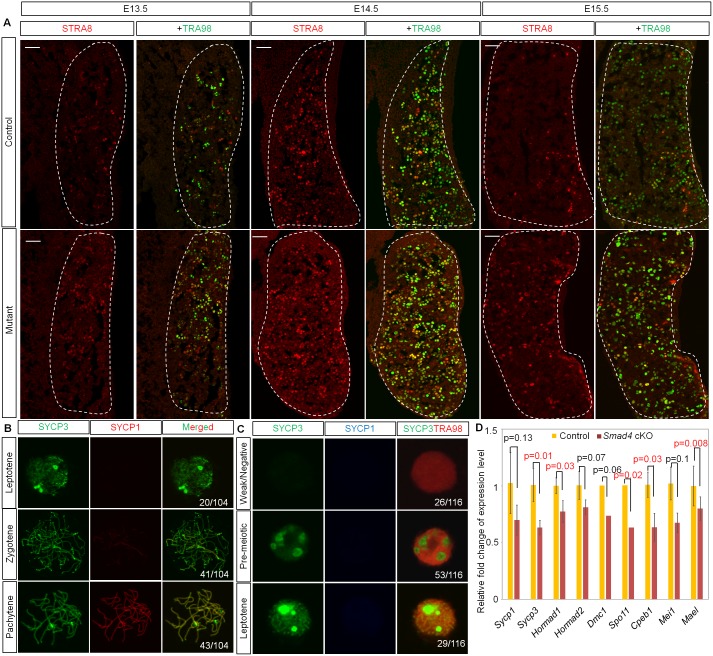
Fig 2. Initiation of meiosis but failure of meiotic progression in Smad4 (Stella) germ cells.
(A) Representative image of the indicated ovary sections stained for STRA8 and TRA98 at E13.5, E14.5, and E15.5 in control and Smad4 (Stella) mutant ovaries. Ovaries were marked by dotted lines. Scale bars: 50 μm. (B) Representative images of leptotene, zygotene, and pachytene stage oocytes stained with SYCP3 and SYCP1 in control ovaries at E15.5. Number of oocytes in each stage is shown. (C) Representative images of different patterns of germ cells stained with SYCP3 and SYCP1 in Smad4 (Stella) ovaries at E15.5. Number of germ cells in each pattern is shown. (D) Expression level of meiosis-related genes in control and Smad4 (Stella) ovaries at E14.5 (n = 3 each). Data was extracted from microarray analysis (see S1 Data). Data is shown by a bar graph with p-value calculated by Student’s t test. Error bars indicate standard deviation.

