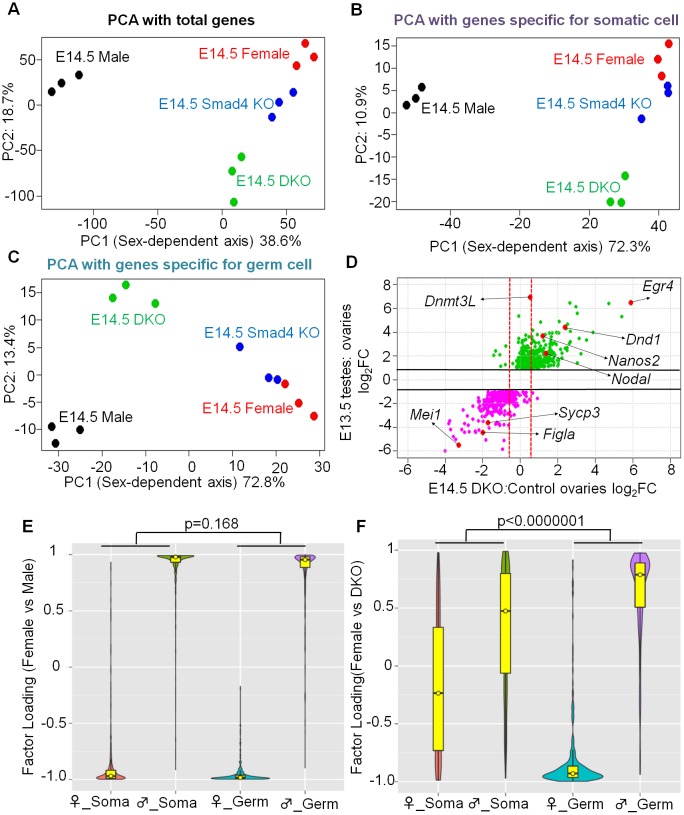
Fig 7. Sexual fate change of mutant XX germ cells was not accompanied by somatic sex reprogramming.
(A–C) Principal component analyses of indicated samples for total genes (A), somatic-specific genes (B), and germ cell specific genes (C). (D) Scatter-plot analysis comparing germ-cell-specific gene expression changes between E13.5 Nanos3+/− male and female gonads (data from [48]) and between E14.5 DKO ovaries and control ovaries. For each point (gene), the y-value represents the expression change comparing E13.5 testes with E13.5 ovaries and the x-value represents the expression change comparing E14.5 DKO ovaries and control ovaries. Thus, green and pink spots indicate 1.5-fold upregulated or downregulated expression in E13.5 testes versus ovaries (y-value greater than log2[1.5] for green spots and y-value less than -log2[1.5] for pink spots: the cut-off lines are indicated by horizontal lines). These spots are considered as genes that are specifically expressed in either male (green) or female (pink) germ cells, and their expression changes between DKO and control ovaries can be judged by the x-value. Red spots indicate specific gene examples. Genes located right of the rightmost dotted red line show more than a 1.5-fold increase in DKO, and genes located left of the leftmost dotted red line show less than a 1.5-fold decrease in DKO compared with control ovaries. Because genes that are specifically expressed in germ cells and somatic cells were extracted using microarray data of Nanos3+/- ovaries and testes, we used Nanos3+/- ovaries and testes as control. (E,F) Factor loading of indicated gene groups to principle component. PCA analysis was performed using E13.5 Nanos3+/− male and female gonads (E) and E14.5 double-mutant and control ovaries (F). See text for details.

