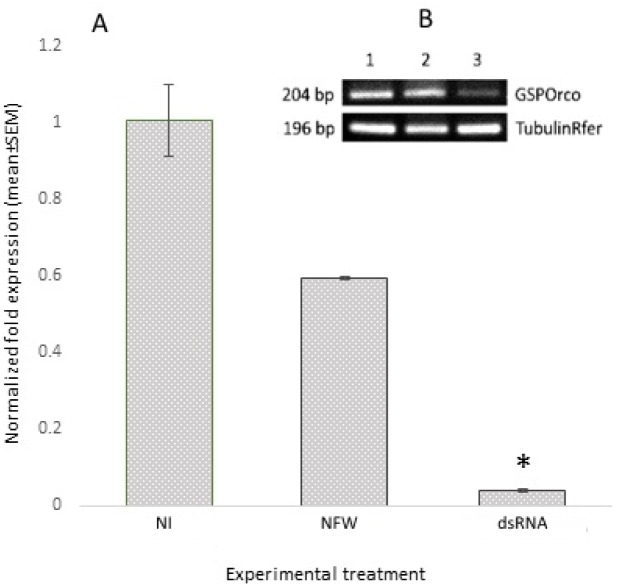
Fig 4.
A. Normalized fold expression of dsRNA RferOrco-injected group (dsRNA) compared with no-injection (NI) and nuclease free water-injected (NFW) group. The asterisk (*) above the dsRNA-RferOrco bar indicates significant differences between selected groups (dsRNA) and other groups (LSD at P<0.05). B. Representative visual band of the 1. NI, 2. NFW, and 3. dsRNA groups. The first row shows the expression of GSPOrco in the different experimental groups, and the second row shows tubulin expression in the different experimental groups.

