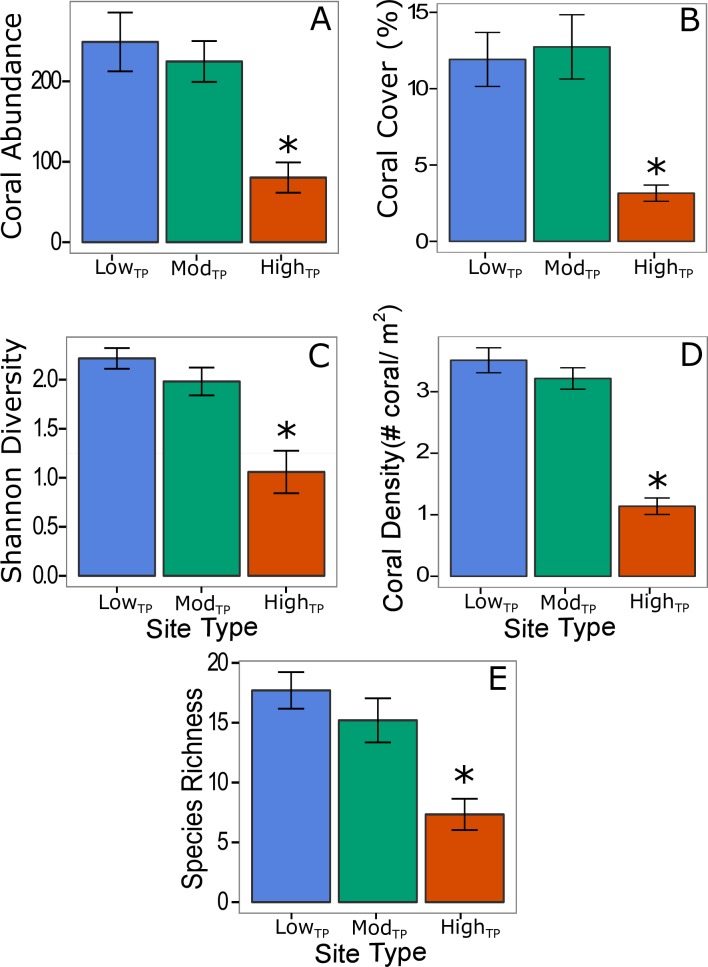
Fig 2. Differences in coral community structure across site type.
Average coral abundance (A), percent coral cover (B), coral species diversity (C), coral density (D), and coral species richness (E) at each site type. Statistically significant differences (p<0.05) are marked with an *. Blue, green, and red bars (± 1 SE) represent lowTP, modTP, and highTP, respectively.

