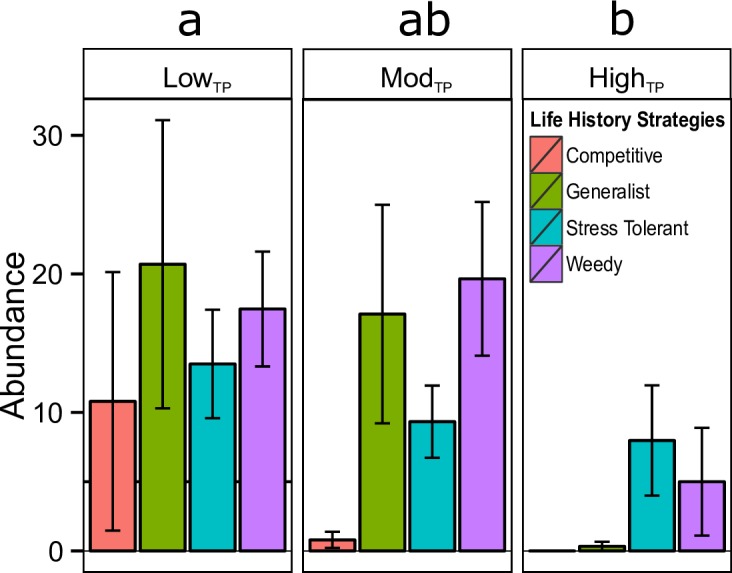
Fig 4. Coral life history strategy by site type.

Abundance (count) of corals (±1 SE) grouped by life history (from Darling et al. 2012). Letters ‘a’ and ‘b’ show significant differences between site types (p<0.050) acquired from post hoc Tukey tests.
