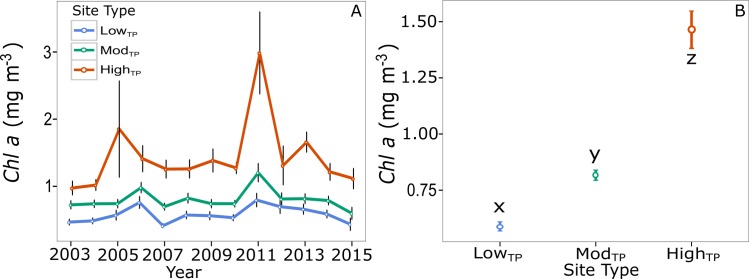
Fig 5. Average chl-a by site type.
Chl-a concentration by site type (±SE) Annual average chl-a for lowTP (blue), modTP (green), highTP (red) site types over the interval 2003–2013 (A). Chl-a concentrations averaged over the 13-year interval (B). Letters x, y, and z indicate results of post hoc Tukey tests showing significant differences in 13-year chl-a concentrations across site types (p<0.050).

