
Figure 2.
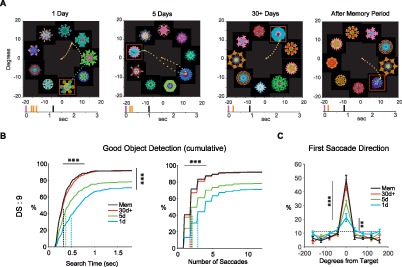
Effects of the repeated object-reward association on the detection of Good objects (DS: 9). (A) Example search performance of monkey R after different training amounts and memory period. Eye position is shown by time-dependent color-coded dots (2/ms dot, from orange to blue). Red square indicates Good object (not shown to the monkey). Tick marks at bottom show the timings of saccades (orange) and reward (black) relative to display onset (purple). (B) Search time and number of saccades (cumulative) for detecting Good object, shown separately for different training amounts (left and right, respectively). Dotted lines: average of median across search sessions. Detection of Good objects shows significant increase and median search time and saccade number shows significant decrease by longer reward training. (C) Distribution of the first saccade directions toward nine equally spaced objects relative to Good object for different training amounts. Dotted line: chance level. First saccade toward Good object was already higher than chance even after 1-day training and significantly increased by longer reward training. Data in (B) and (C) are from all four monkeys. *p < 0.05, **p < 0.01, ***p < 0.001.