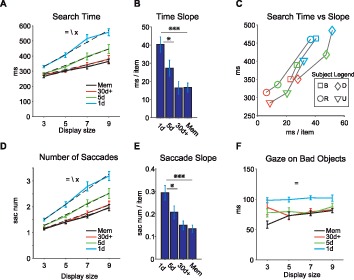
Figure 5.

Effects of the display size (DS) on the detection of Good objects. (A) Time to find the Good object (search time, ordinate) against the number of presented objects (DS, abscissa) for different training amounts and for memory. Dashed lines: linear fits. (B) Changes in search time slope by training amounts and for memory. Post hoc tests show significant change in slope between groups. (C) Search time (ordinate) and search time slope (abscissa) for individual subjects (monkeys B, D, R, U) after different training amounts (blue: 1d, green: 5d, red: 30 days+, Mem not shown). (D) and (E) Number of saccades to find the Good object, shown in the same format as in (A) and (B). (F) Duration of gaze on Bad objects for different training amounts. (=, \, ×: main effect of training amount, display size, and interaction, respectively). *p < 0.05, **p < 0.01, ***p < 0.001.
