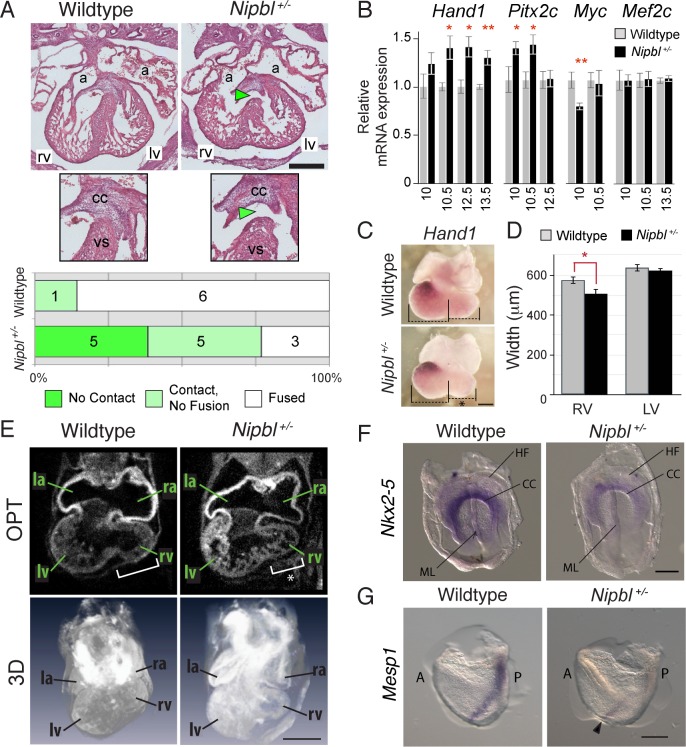
Fig 1. Nipbl-deficient mice show abnormalities throughout heart development.
A. Hematoxylin and Eosin Y (H&E)-stained sectioned hearts illustrating delay in fusion of ventricular septum (VS) with cardiac cushion (CC) in Nipbl+/- mice at E13.5. The majority of wildtype hearts display a fully-developed VS fused with the CC (left panels); 1/7 (14%) display a mild phenotype (contact between the CC and VS, but no fusion). 77% (10/13) of Nipbl+/- hearts show a defect in VS fusion: 38% (5/13) have a complete lack of contact between VS and CC (right panels, green arrowhead); 38% (5/13) have a milder phenotype (contact between the CC and VS, but no fusion). Frequencies of each defect are plotted in histogram. p = 0.0166, Fisher’s Exact test (Nipbl+/-, 10/13 versus wildtype, 1/7). a, atrium; lv, left ventricle; rv, right ventricle; vs, ventricular septum. Size bar = 400 μm. B. Quantitative reverse transcription PCR (qRT-PCR) was performed on hearts at different stages between E10 and E13.5. Relative expression of Hand1, Pitx2, and cMyc, but not Mef2c, differed significantly in Nipbl+/- versus wildtype hearts at indicated stages. Histogram shows mean ± standard error of the mean (SEM) of relative gene expression. *p < 0.05, ** p < 0.01, Student’s t test (S1 Data). C. In situ hybridization (ISH) for Hand1 at E10.5 showing similar pattern of expression between Nipbl+/- and wildtype hearts. A discrepancy in the size of the developing right ventricle of Nipbl+/- hearts is observable (black asterisk). Size bar = 400 μm. D. Left and right ventricle diameters were measured from whole mount E10.5 heart images using Axiovision software (Zeiss). Histograms plot means (± SEM) for right and left ventricle diameters of Nipbl+/- hearts (n = 5) and stage-matched wildtype littermate controls (n = 7). * p < 0.05, Student’s t test. E. OPT images showing sections and 3-D reconstructions of E10.5 hearts, illustrating that right ventricles are smaller in E10.5 Nipbl+/- hearts (white asterisk). Size bar = 400 μm. F. ISH at cardiac crescent stage (E7.5) shows a reduction in Nkx2-5 expression in the cardiac crescent (CC) of Nipbl+/- mice (n = 2) compared to wildtype littermates (n = 3). ML, midline; HF, headfold. Scale bar: 200 μm. G. ISH at primitive streak stage (E6.5) shows a drastic reduction in Mesp1 expression in Nipbl+/- embryos (n = 5, black arrowhead) compared to wildtype littermates (n = 5). A, anterior; P, posterior. Scale bar: 200 μm.

