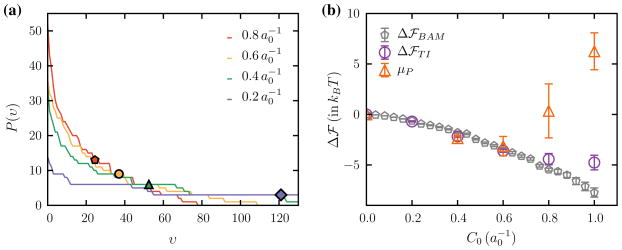
Fig. 2.
a Distribution of the number of unique vertices P(ν), visited in a TI simulation with λ ~ 1, for four different values of C0. The points shown alongside each curve correspond to the standard deviation σψ. b Comparison of the relative free energies to add one protein to a membrane with zero proteins computed using TI, BAM, and Widom insertion

