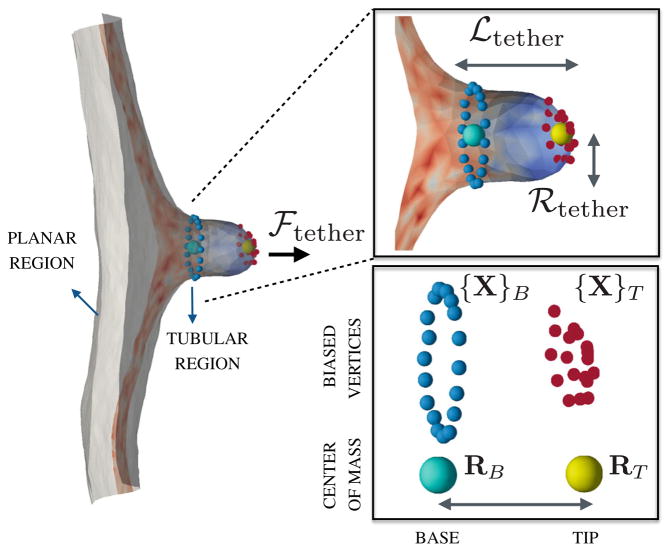
Fig. 3.
(left panel) A snapshot of a tether extracted from a patch of a planar membrane. (right panel) A closer view of the tubular region of length ℒtether and radius ℛtether with the colors denoting the mean curvature of the surface—the tubular region has a positive mean curvature and the neck region has a negative mean curvature. The tip and base regions on the membrane tether are represented by the marked vertices on the tubular membrane along with the position of their center of mass

