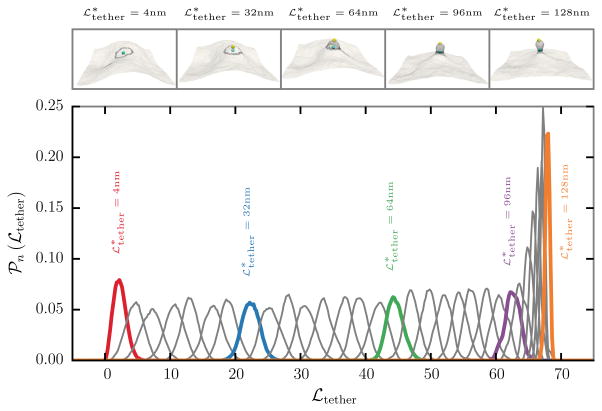
Fig. 4.
(top panel) Snapshots of a membrane subject to a biasing potential, along with the positions of the center of masses, for five different values of the preferred tether length , 32, 64, 96, and 128 nm. (bottom panel) 𝒫n(ℒtether), the probability distribution of the tether length ℒtether in 32 different biasing windows with a window size of 4 nm. The curve corresponding to the snapshots in the top panel are shown as solid colored lines along with the corresponding values of the preferred tether length

