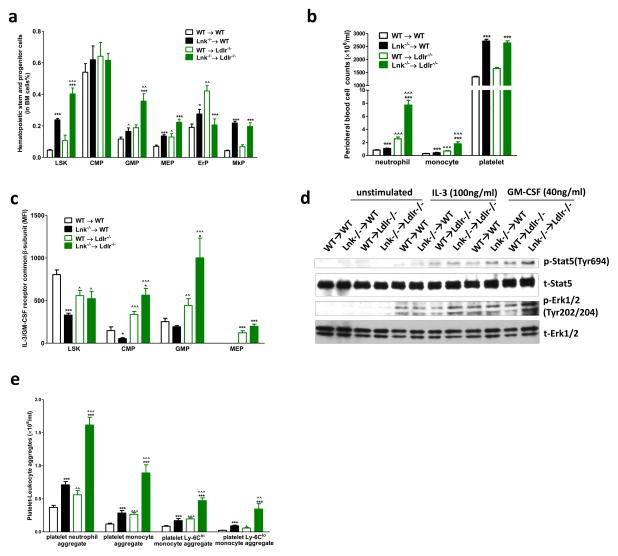
Figure 2. Hypercholesterolemia markedly increases myelopoiesis in Lnk−/− BM recipient.
Hematopoietic stem and progenitor cells in BM (a), peripheral neutrophil, monocyte and platelet counts (b), cell surface CBS levels (c) and platelet neutrophil/monocyte aggregates (e). n=14–15. (d) p-Erk and p-Stat levels in BM cells with and without stimulation of IL-3 (100ng/ml) and GM-SCF (40ng/ml).
Black bars represent chow feeding and green bars represent WTD feeding for 12 weeks. *, **, *** denote p<0.05, <0.01 and <0.001 for WTD-fed Lnk −/− vs WT or chow-fed Lnk −/− vs WT. ^, ^^, ^^^ denote p<0.05, <0.01 and <0.001 for chow-fed Lnk −/− vs WTD-fed Lnk −/− or chow-fed WT vs WTD-fed WT.

