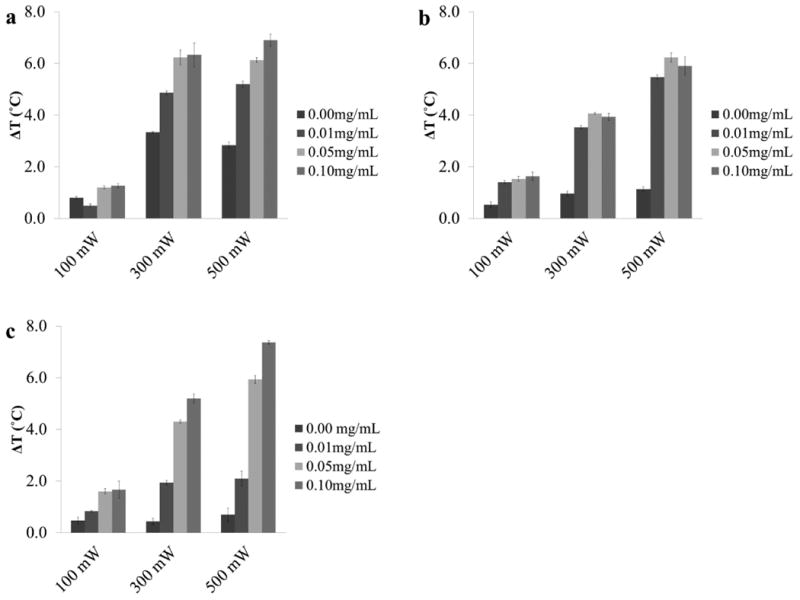
Fig. 3.

The measured temperature change of 1 mL aqueous solutions with 0, 0.01, 0.05, and 0.1mg/mL of (a) cardiogreen, (b) methylene blue and (c) riboflavin after 5 min of light exposure (cardiogreen: 900 nm; methylene blue: 650 nm; and riboflavin: 450 nm) at 100, 300 and 500mW (n=3). For each chromophore studied, increasing the concentration of chromophore, the power of the light source, or both increased the measured temperature changes.
