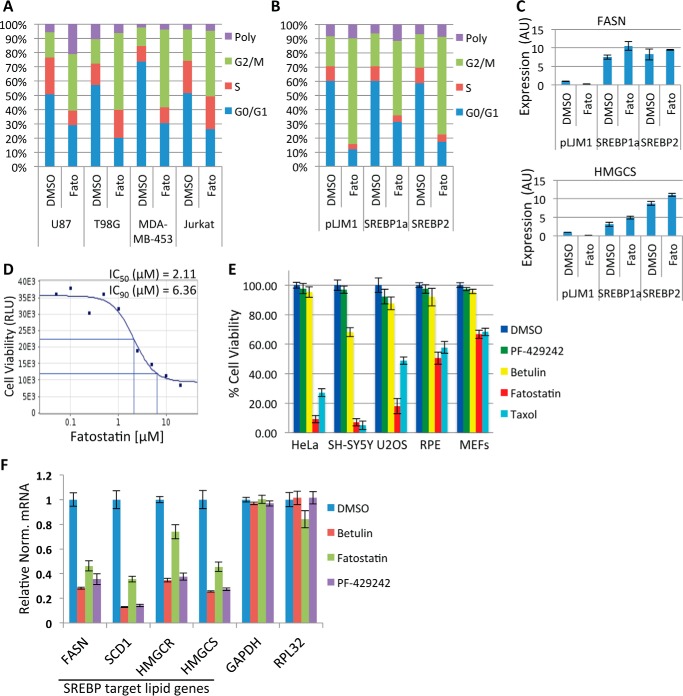
FIGURE 1.
Fatostatin inhibits SREBP maturation and arrests cancer cells in G2/M. A, U87, T98G, MDA-MB-453, and Jurkat T-cells treated with DMSO or 5 μm Fatostatin (Fato) for 24 h (U87 cells were treated for 48 h). Cells were stained with propidium iodide, and their cell cycles were analyzed by FACS. B, same as in A, except that U87 cells were infected with lentivirus expressing truncated hSREBP1a (aa 1–490), hSREBP2 (aa 1–484), or an empty vector (pLJM1). Poly, polyploid. C, a fraction of cells in B were collected and analyzed for SREBP target lipid gene expression (FASN and HMGCS1) by RT-qPCR. AU, arbitrary units. D, HeLa cells were treated with increasing concentrations of Fatostatin for 48 h. Cell viability was measured, and IC50s and IC90s were generated. E, cancer (HeLa, SH-SY5Y, and U2OS) and normal (RPE and MEFs) cells were treated with DMSO, 2.11 μm Fatostatin, 10 μm Betulin, or 10 μm PF-429242 for 60 h, and cell viability was measured as in D. F, HeLa cells were treated as in E for 24 h, and gene expression levels of SREBP target lipid genes and non-SREBP genes were quantified by RT-qPCR. Data are presented as relative normalized (Relative Norm.) mRNA levels to the 36B4 control gene. Data represent average ± S.D. deviation of three independent experiments.

