
FIGURE 6.
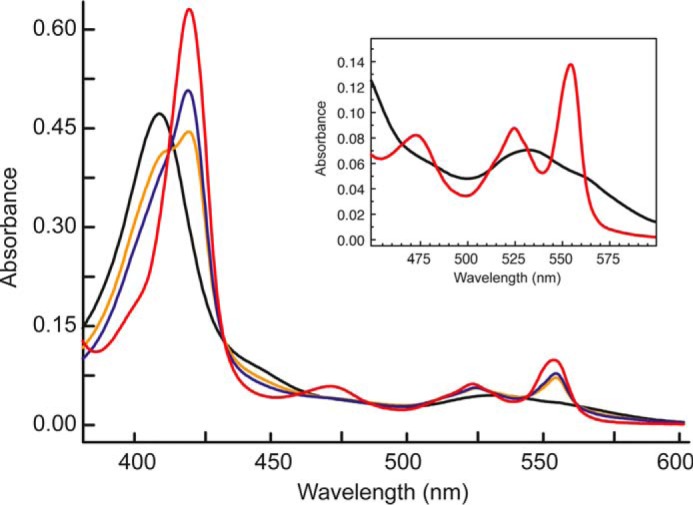
Effect of hydrazine on the electronic absorbance spectrum of KsHDH. Spectra are as follows: as-isolated KsHDH (45 μg·ml−1; 0.67 μm) (black line); fully (dithionite) reduced spectrum (red line); and partially reduced KsHDH in the presence of 1 μm hydrazine (orange line) and in the presence of 3 μm hydrazine (blue line). From the increase in the Soret band at 419 nm, it is inferred that the presence of 1 and 3 μm hydrazine resulted in the reduction of ∼3 and 4 His/His-ligated c-type hemes, respectively, assuming that each heme contributes equally to a spectral change. The inset details the spectrum of as-isolated KsHDH in the 450–600 nm region.