FIGURE 7.
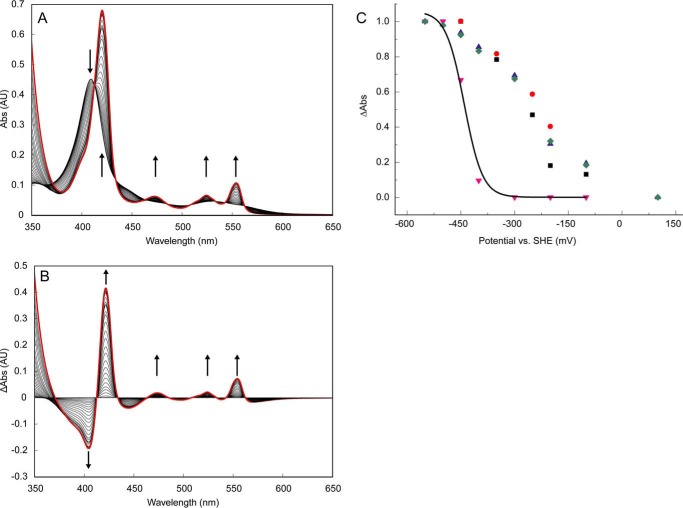
Optical redox determinations of KsHDH. A, reduction of as-isolated KsHDH (43 μg ml−1; 0.64 μm) by the sequential addition of dithionite aliquots under anaerobic conditions. Spectra were corrected for the effect of dilution by the additions. AU, absorbance units. Arrows, directions of the spectral changes. The absorbance band at 473 nm derived from the P460 prosthetic group appeared only after the complete reduction of the His/His-ligated c-type hemes featured in their reduced state by their absorption maxima at 420, 524, and 554 nm. The spectrum of fully reduced KsHDH is highlighted by the red line. B, reduced minus oxidized absorbance spectra during dithionite reduction. Note that spectral changes occur around distinct isosbestic points at 412, 433, 464, 485, 508, 533, and 562 nm, indicating that the spectral changes as the result of the reduction of the P460 catalytic heme do not interfere with those of the His/His-ligated c-type hemes. C, redox titration of KsHDH (∼30 μm) in an optical transparent thin layer electrochemical cell. Normalized redox potential-dependent spectral changes of the His/His-ligated hemes of KsHDH were followed in oxidative (ox) and reductive (red) directions at 554 nm (black squares, oxidative; blue triangles, reductive) and at 420 nm (red circles, oxidative; green diamonds, reductive). Spectral changes at 473 nm as a result of the reduction of the P460 prosthetic group are shown as red triangles. Data were fitted (black line) by a Nernstian curve, assuming a one-electron reduction resulting in an Em = −420 mV.

