
FIGURE 5.
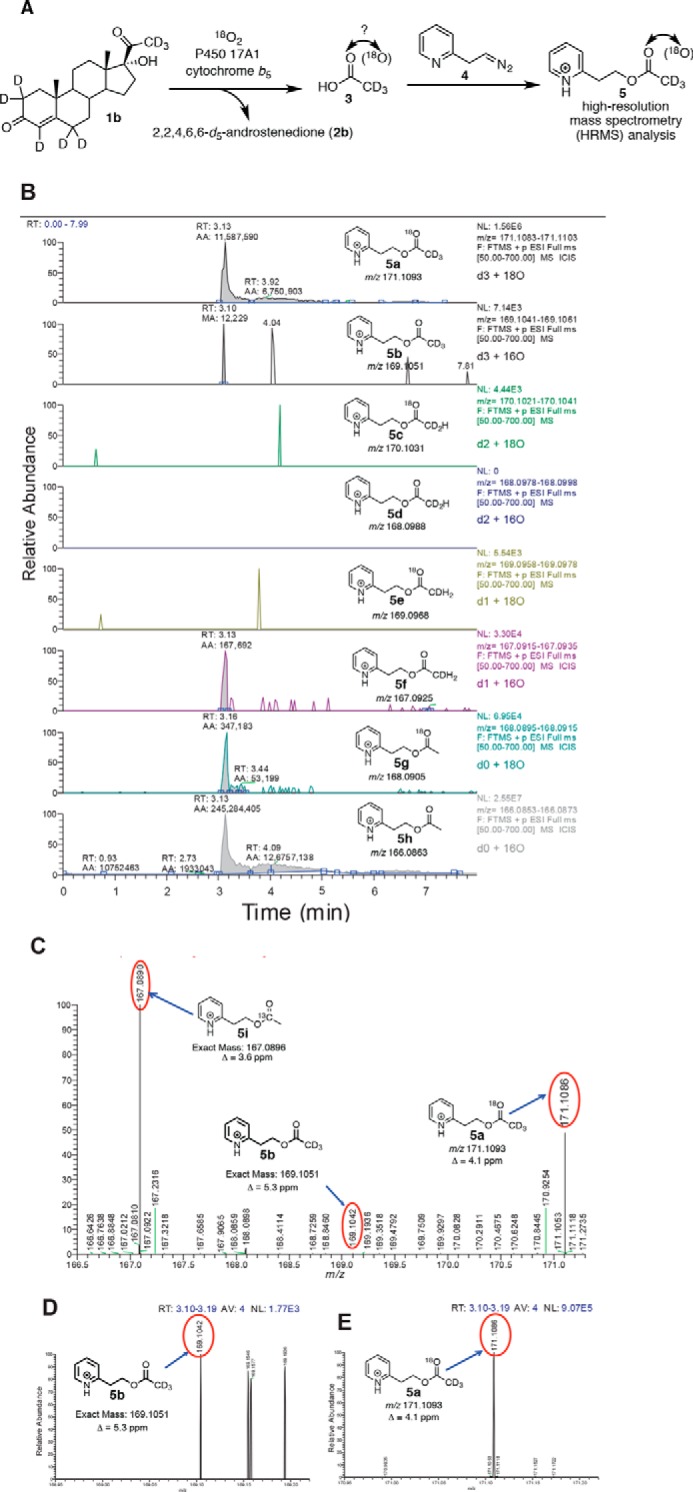
P450 17A1 incubation with 17α-hydroxy-[2,2,4,6,6,21,21,21-2H8]progesterone (1b) in the presence of 18O2 followed by derivatization and analysis by HRMS. A, scheme showing the incubation of deuterated lyase substrate (1b) with P450 17A1 and cytochrome b5 in the presence of 18O2. The acetic acid product (3) was derivatized with the diazoethylpyridine reagent (4) and analyzed by liquid chromatography-HRMS. B, ion chromatograms monitoring the various isotopically labeled acetate products that were derivatized to the pyridylethyl esters (5a–h), with 6 ppm mass tolerance parameter. a, m/z 171 window (d3, 18O); b, m/z 169 window (d3, 16O); c, m/z 170 window (d2, 18O); d, m/z 168 window (d2, 16O); e, m/z 169 window (d1, 18O); f, m/z 167 window (d1, 16O); g, m/z 168 window (d0, 18O); h, m/z 166 window (d0, 16O). C, mass spectrum of the m/z 166.5–171.3 range by selecting the tR 3.10–3.19-min time interval in the ion chromatogram corresponding to the pyridine ester retention time. Shown at m/z 167.0890 is the peak corresponding to the acetate from background acetic acid from the natural abundance of 13C isotope (5i, expected mass, m/z 167.0896, Δ 3.6 ppm). The peak at m/z 171.1099 corresponds to the acetate derived from the enzymatic product (5a, expected mass, m/z 171.1093, Δ 4.1 ppm). D, expansion of the mass spectrum (m/z 168.95–169.22) (from C) showing the detection of d3-labeled acetate with no 18O incorporation (5b, expected mass, m/z 169.1051, Δ 5.3 ppm). E, expansion of the mass spectrum (m/z 170.95–171.22) from C showing the presence of d3-labeled acetate with 18O incorporation (5a, expected mass, m/z 171.1093). p, profile (peaks are shown in profile mode and not “centroid”). ESI, electrospray ionization. RT, retention time. NL, normalized level. More information about the meaning of the settings can be obtained from the Xcalibur Qual Browser User Guide (Thermo Scientific).