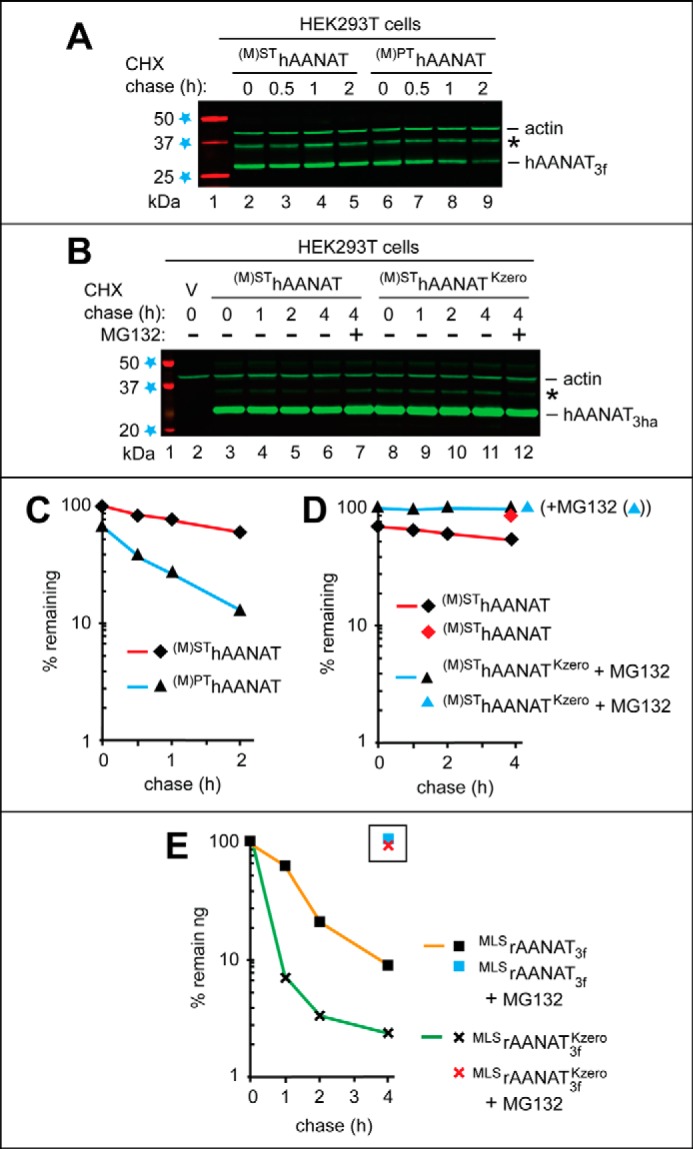
FIGURE 7.

Degradation of the wild-type human (M)SThAANAT and its mutants in human HEK293T cells. The test proteins were expressed in HEK293T cells using a plasmid bearing the (weakened) PCMVt1 promoter (see “Results” and see Fig. 5, A–C). A, lane 1, fluorescently labeled molecular mass markers (LI-COR), with their masses, in kDa, indicated on the left. CHX-chases were performed at 37 °C for the indicated times in HEK293T cells with the wild-type human (M)SThAANAT3f (lanes 2–5) and with its mutant (M)PThAANAT3f (lanes 6–9). B, lane 1, fluorescently labeled molecular mass markers, with their masses, in kDa, indicated on the left. Lane 2, HEK293T cells were transformed with vector (V) alone (control). CHX-chases were performed at 37 °C for the indicated times in HEK293T cells with the wild-type human (M)SThAANAT3ha (lanes 3–6) and with its lysine-lacking mutant (M)SThAANAT3haKzero (lanes 8–11). Lanes 7 and 12, same as lanes 6 and 11, except that the MG132 proteasome inhibitor was present during a 4-h CHX-chase in each case (see “Experimental Procedures”). The bands of actin and AANAT are indicated on the right. Asterisks on the right in A and B denote a protein band (possibly the same protein and possibly a derivative of AANAT) that reacted with both anti-FLAG antibody in A and anti-HA antibody in B. C, quantification of data in A. D, quantification of data in B. E, quantification of data in Fig. 6B (right), similar to the analogous quantifications described in the legend to Fig. 6, C and D. All quantified CHX-chase assays were carried out at least three times and yielded results within 10% of the data shown.
