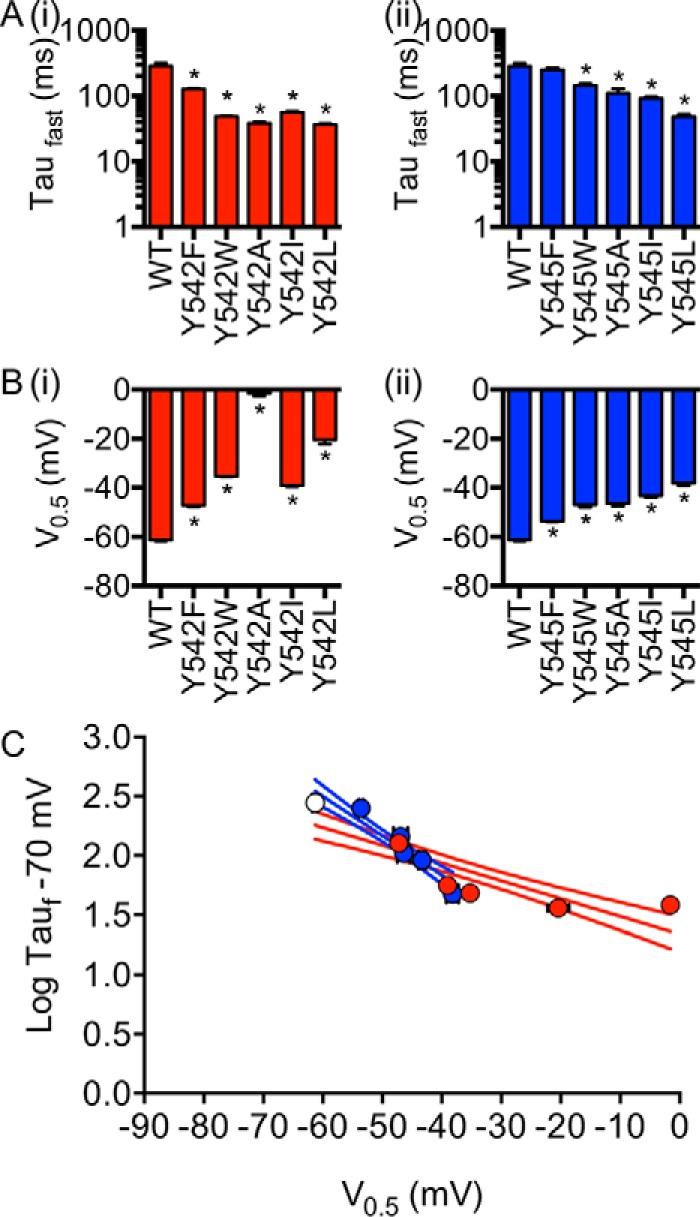
FIGURE 6.

Tyr-545 (blue) is functionally different to Tyr-542 (red). A, time constants of deactivation at −70 mV for different Tyr-542 (panel i) and Tyr-545 (panel ii) side-chain residues. B, 3-s isochronal deactivation V0.5 for Tyr-542 (panel i) and Tyr-545 (panel ii) side-chain residues. Data are presented as mean ± S.E. * indicates p < 0.05 versus WT using one-way ANOVA with Bonferroni post-test. C, relationship between time constants of deactivation for different WT (white), Tyr-542 (red), and Tyr-545 (blue) side-chain residues at −70 mV and their corresponding deactivation V0.5. Linear regression with 95% confidence interval was fitted to each dataset.
