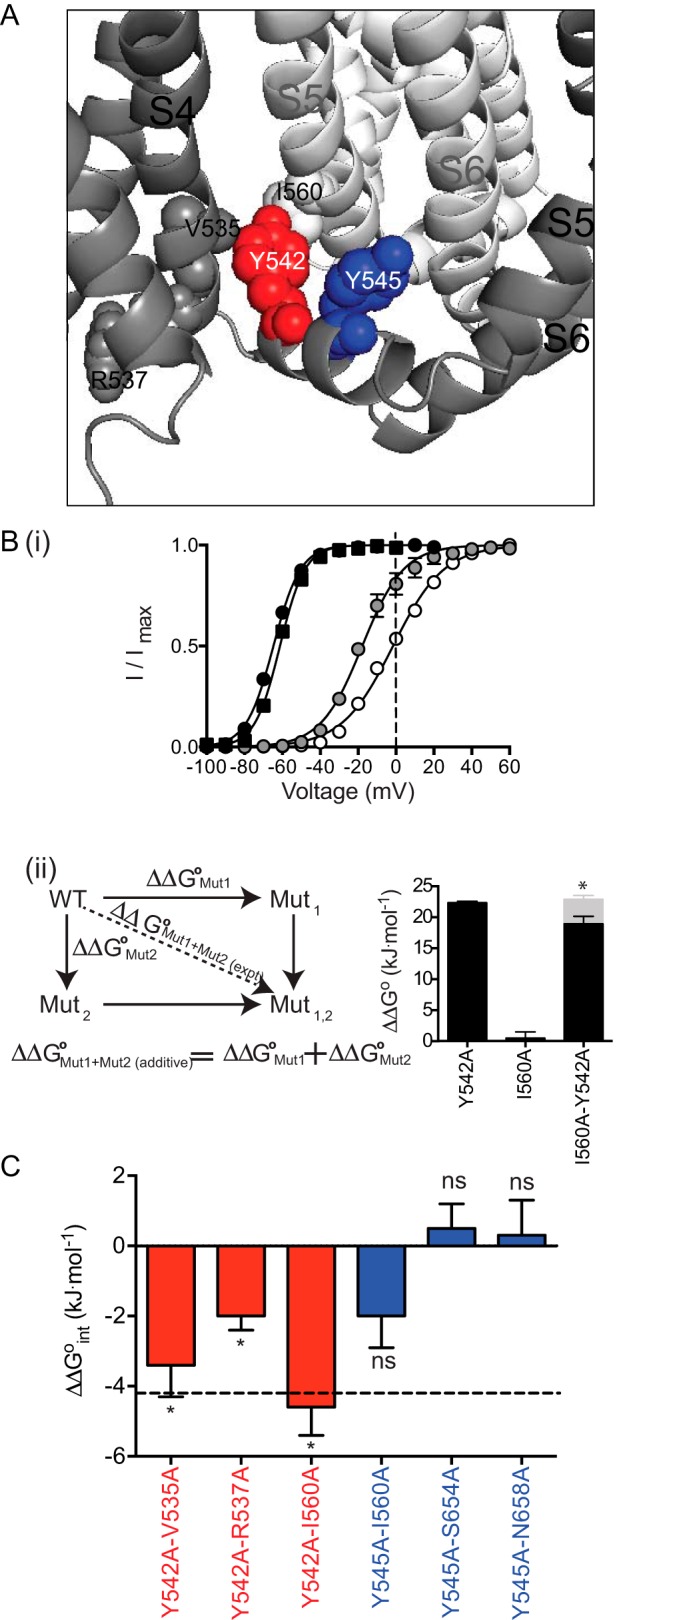
FIGURE 7.

Double mutant cycle analysis of Tyr-542 and Tyr-545. A, orientation of Tyr-542 (red) and Tyr-545 (blue) within the S4S5 linker and the residues that were energetically coupled. B, 3-s isochronal deactivation curves for WT (black circle), I560A (black square), Y542A (white circle), and I560A/Y542A (gray circle). 0 mV was indicated by dotted lines to show the differences between the individual and double mutations (panel i). The additivity effect ΔΔG0Mut1 + Mut2 (additive) is the summation of ΔΔG0 from the individual mutations (panel ii). Comparison between the ΔΔG0 obtained from experiment (black) and additivity effect (gray) for double mutant I560A and Y542A are shown on the right of panel ii. C, summary of the double mutant cycle analysis displayed as the ΔΔG0Mut1 + Mut2 (int) for the Tyr-542 double mutants (red) and Tyr-545 double mutants (blue). * indicates statistical differences, p < 0.05 using an unpaired t test when comparing the experimentally derived ΔΔG0 for the double mutant with the sum of the ΔΔG0 values for the two individual mutants. Only the double mutant I560A/Y542A has an interaction energy greater than 4.2 kJ mol−1, indicated by the dotted line. Data are presented as mean ± S.E.
