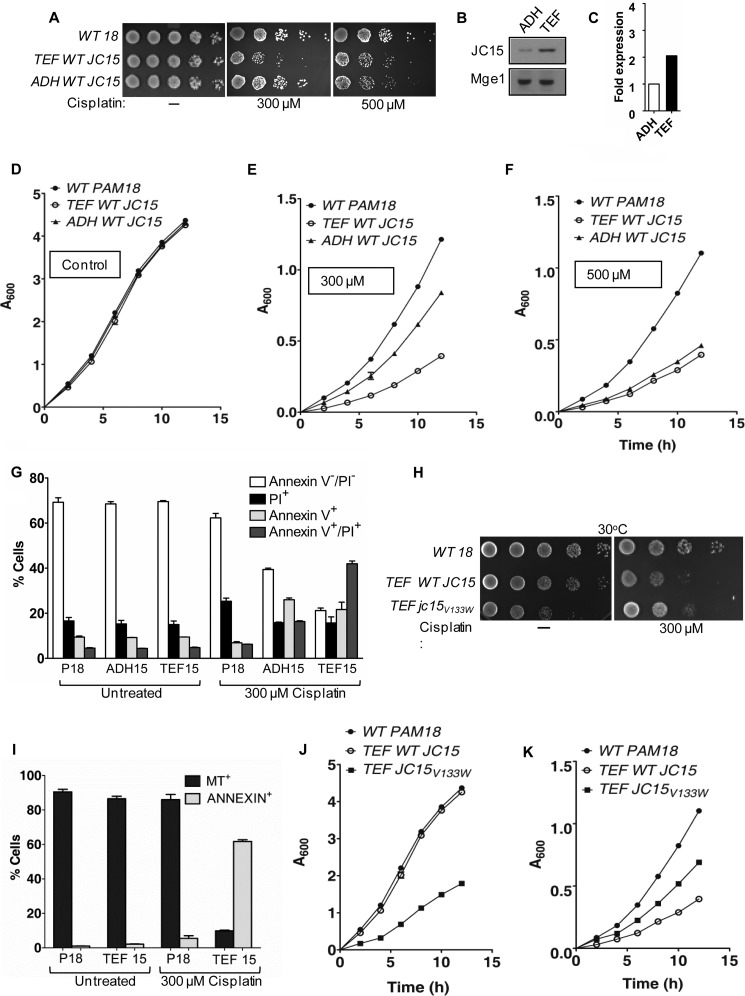
FIGURE 8.
Modulation of cellular response to cisplatin by JC15. A, yeast cells expressing wild type Pam18 or JC15 were exposed to 300 μm or 500 μm cisplatin, and drop dilution analysis was performed on rich media. The plates were incubated at 30 °C for 48 h. B, expression immunoblot of yeast cells expressing JC15 under TEF or ADH promoter. Mge1 was used as loading control. C, the immunodecorated bands were quantified and are represented as -fold expression in the form of a bar chart. The densitometric unit of ADH-JC15 was set to 1. D, E, and F, growth curve analysis of yeast cells exposed to 300 μm or 500 μm cisplatin and incubated at 30 °C for indicated time periods. G, induction of apoptotic cell death by JC15. Yeast cells were left untreated or treated with 300 μm cisplatin before staining with annexin V and propidium iodide (PI) to label the apoptotic cell population. The relative number of cells positive for the dyes was represented as percent cells over the total analyzed cell population. The bar represents the mean ± S.E. n = 3; p (two tailed) < 0.001. H, wild type and mutant cells were exposed to 300 μm cisplatin and subjected to drop test analysis on yeast extract/peptone/dextrose followed by incubation at 30 °C for 48 h. I, yeast cells left untreated or exposed to cisplatin were stained with annexin V and MitoTracker Red (MT) to identify apoptotic cells with loss of mitochondrial membrane potential. The number of cells positive for the dyes is represented as a percentage for the total cell population analyzed. Bars represent mean ± S.E. n = 3, p (two tailed)< 0.001. J and K, yeast cells were incubated untreated (J) or treated with 300 μm cisplatin (K), and the growth of cells were monitored at 30 °C.

