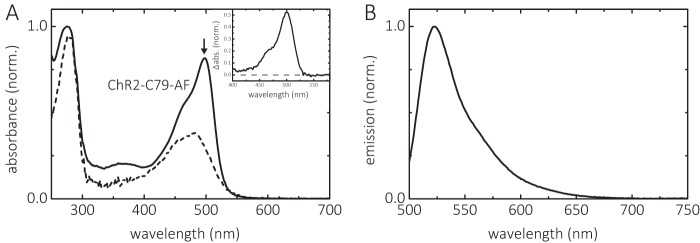
FIGURE 2.
Absorption and emission spectra of ChR2CA/C128T-C79-AF/C208. A, absorption spectra before (dashed line) and after (solid line) labeling with IAF at alkaline pH (pH 8), yielding ChR2CA/C128T-C79-AF/C208 (in short ChR2-C79-AF). The arrow indicates the absorption maximum of deprotonated bound fluorescein. The inset shows the absorption of fluorescein derived from the difference spectrum between labeled and unlabeled channel. B, emission spectrum of ChR2CA/C128T-C79-AF/C208. The conditions were 0.2% DM, 100 mm NaCl at 20 °C.

