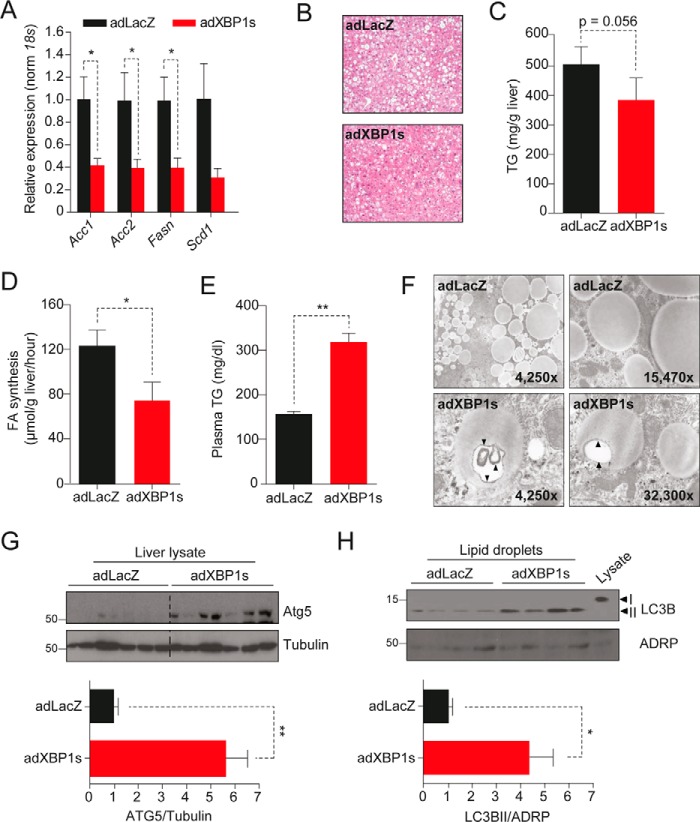
FIGURE 3.
Enhanced macrolipophagy in XBP1s-injected ob/ob mice. Leptin-deficient obese and diabetic ob/ob mice (10 weeks old) on a C57Bl6/J background were injected with adLacZ or adXBP1s (8*10E7 pfu/g) through the tail vein. A, relative hepatic mRNA levels of the lipogenic genes Acc1, Acc2, FasN, and Scd1 in livers of adLacZ- and adXBP1s-injected mice. Gene expression was normalized using the 18s gene as a housekeeping gene. B, livers were fixed and prepared for H&E staining. Pictures are representative sections of livers of adLacZ- and adXBP1s-injected mice (×4 magnification). C, liver triglyceride content was determined in 6 h-fasted mice on day 9 post-adenovirus injection. D, the hepatic fatty acid synthesis rate was determined by [3H2O] (2 mCi/mouse) injection on day 5 post-injection. Fatty acids were extracted and subsequently analyzed by TLC. The rate of hepatic fatty acids was calculated as the amount of [3H] incorporated into fatty acids per gram of tissue per hour. E, plasma triglyceride levels were determined in 6 h-fasted mice on day 9 post-adenovirus injection. F, livers of 6 h-fasted mice were fixed for electron microscopy analysis on day 9 post-adenovirus injection. Pictures are representative electron microscopic images of lipid droplets in the liver of adXBP1s and adLacZ-injected mice. G, Western blotting analysis of ATG5 protein in whole liver homogenates. Tubulin was used as a loading control (top panel). ATG5 and tubulin protein expression levels were quantified using densitometric analysis and expressed as a ratio ATG5/tubulin in adLacZ and adXBP1s-injected mice (bottom panel). H, Western blotting analysis of LC3IIB and ADRP (as a control) protein levels in isolated lipid droplets from livers of adLacZ and adXBP1s-expressing mice. Note that each lane contains proteins isolated from lipid droplets of one ob/ob mouse liver (top panel). LC3BII and ADRP protein expression levels were quantified using densitometric analysis and expressed as a ratio of LC3BII/ADRP in adLacZ- and adXBP1s-injected mice (bottom panel). Error bars are represented as mean ± S.E.; p values were determined by Student's t test. *, p < 0.05; **, p < 0.01; ***, p < 0.001.

