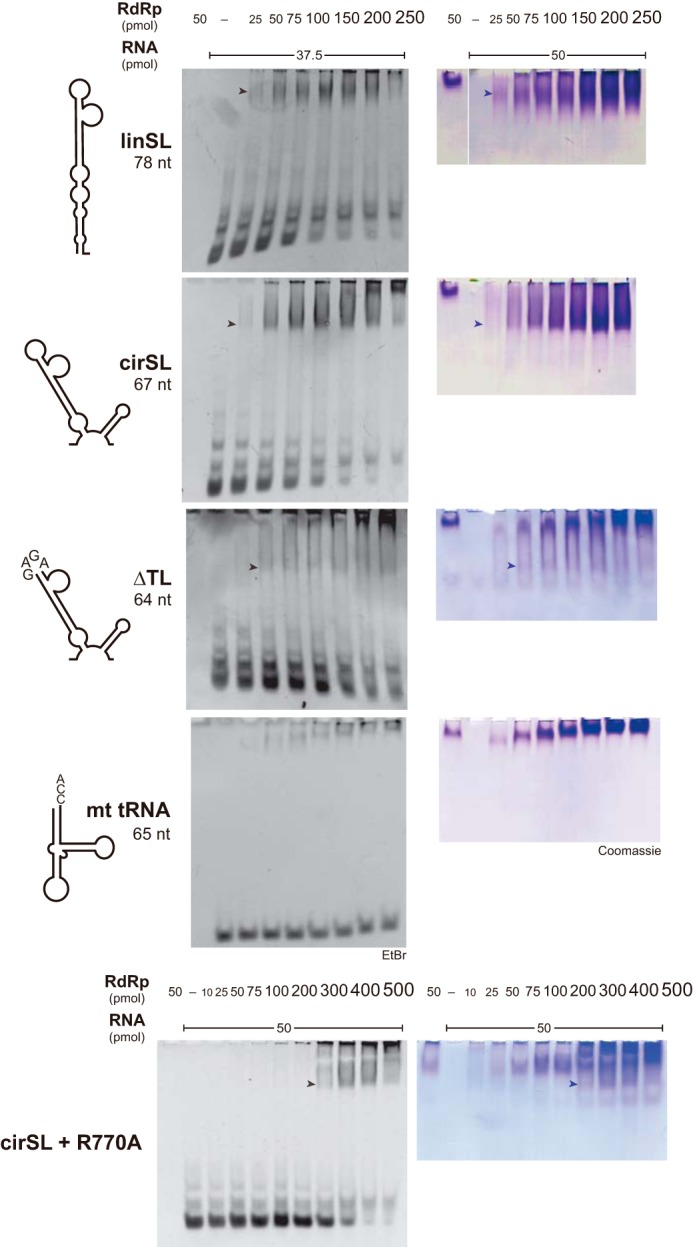
FIGURE 3.

In vitro EMSA. Mfold secondary structures of RNAs are depicted in the left column. Arrows highlight protein-RNA complexes that were evident via both EtBr (middle column) and Coomassie (right column) staining. The constant amount of RNA in the reaction was increased from 37.5 to 50 pmol in the case of protein staining. The linSL and cirSL experiments were run on a single gel with one “RdRp alone” lane.
