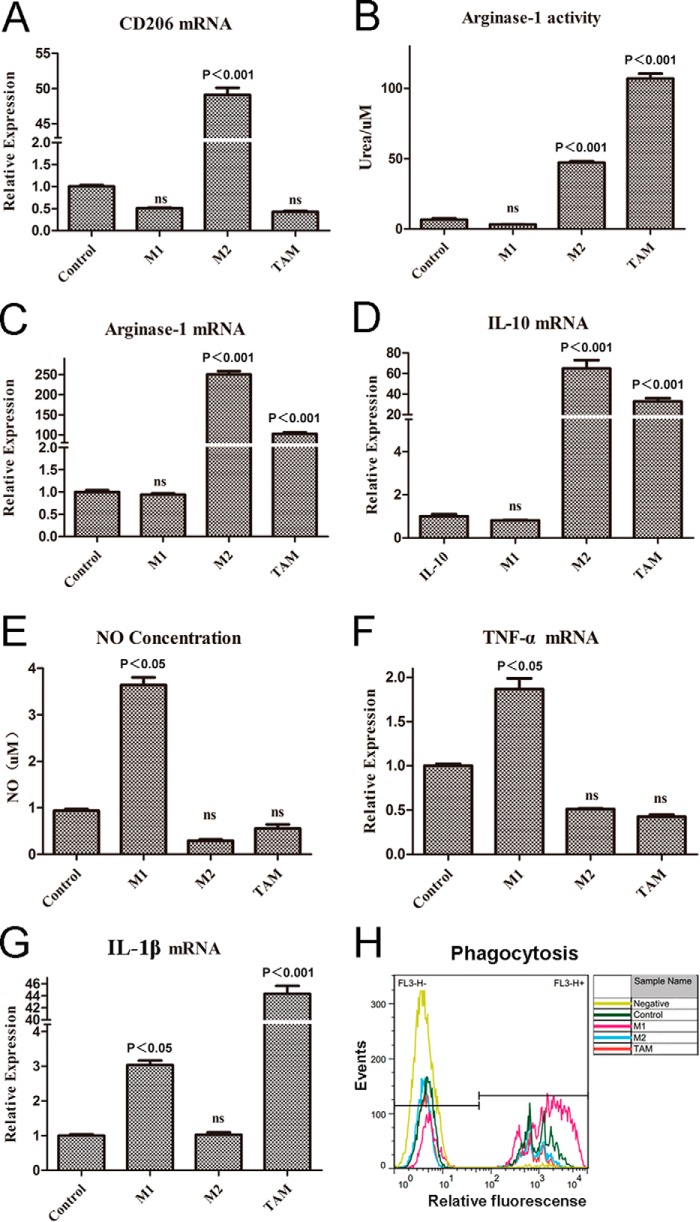
FIGURE 6.
TAMs are mainly toward an alternative M2 activation in vitro. The established macrophage models of M1, M2, and TAMs, RAW264.7 cells were stimulated, respectively, by LPS (100 ng/ml) + IFN-γ (20 ng/ml), IL-4 (10 ng/ml), and 4T1 tumor-conditioned medium for 24 h. A, expression level of CD206 was not changed in TAMs compared with control. Result was measured by quantitative real time PCR. B, for detecting the activity of arginase-1 of the three models, like M2, the activity of arginase-1 in TAMs was up-regulated. C and D, expression levels of arginase-1, IL-10 were measured by quantitative real time-PCR. E, unlike M1, there were no nitric oxide releases in M2 and TAMs. F and G, expression levels of TNF-α and IL-1β were measured by quantitative real time-PCR. H, phagocytosis of M1 was enhanced compared with control, but the phagocytosis of M2 and TAMs was reduced, as measured by flow cytometry analysis. All bars were expressed as means ± S.D. (p values of plotted data ≤ 0.05 were considered statistically significant). ns indicates not significantly different.

