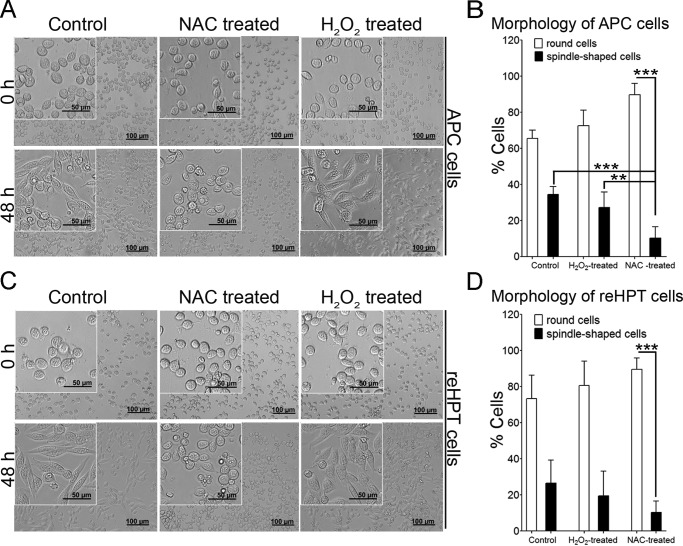
FIGURE 4.
The effect of NAC treatment on cell spreading. A, APC cell morphology 48 h after reduced ROS production through NAC treatment. B, percent of round or spindle-like APC cells (spreading cells) relative to the total APC cell number. The columns represent the mean of three to five crayfish from three to five separate experiments, and the error bars represent the S.D. value. **, p < 0.01; ***, p < 0.001. C, reHPT cell morphology 48 h after reduced ROS production through NAC treatment. D, percent of round or spindle-like reHPT cells relative to the total reHPT cell number. The columns represent the mean of three to five separate experiments, and the error bars represent the S.D. value. ***, p < 0.001.

