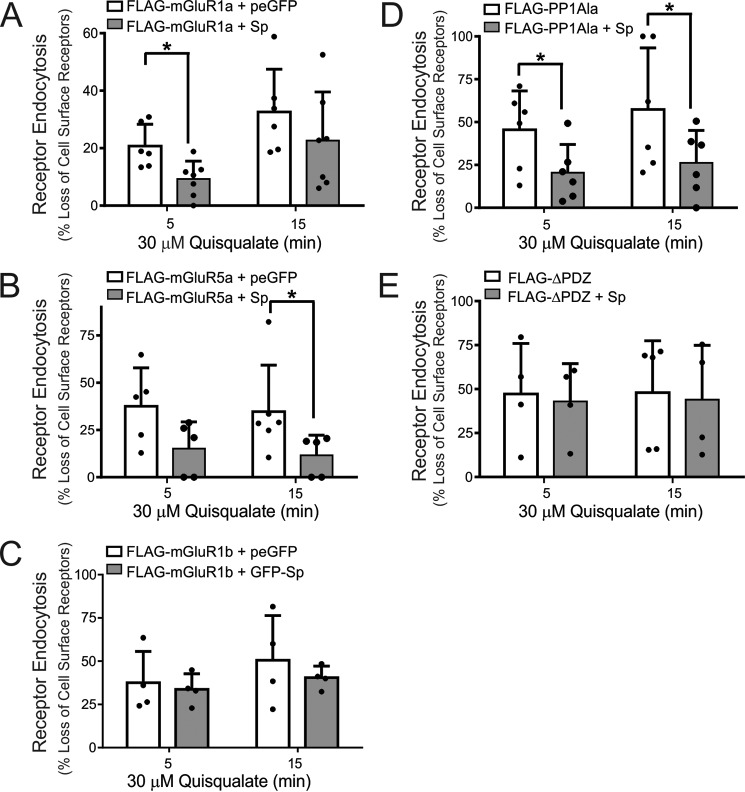
FIGURE 2.
Effect of spinophilin expression on of Group I mGluR endocytosis. A, determination of internalized biotin-labeled FLAG-mGluR1a in HEK 293 cells transfected with 2 μg of pcDNA3.1 encoding FLAG-mGluR1a along with 2 μg of plasmid cDNA encoding either GFP or GFP-spinophilin (GFP-Sp) following treatment with 30 μm quisqualate for 0, 5, and 15 min. B, determination of internalized biotin-labeled FLAG-mGluR5a in HEK 293 cells transfected with 2 μg of pcDNA3.1 encoding FLAG-mGluR5a along with 2 μg of plasmid cDNA encoding either GFP or GFP-spinophilin following treatment with 30 μm quisqualate for 0, 5, and 15 min. C, determination of internalized biotin-labeled FLAG-mGluR1b in HEK 293 cells transfected with 2 μg of pcDNA3.1 encoding FLAG-ΔPDZ along with 2 μg of plasmid cDNA encoding either GFP or GFP-spinophilin following treatment with 30 μm quisqualate for 0, 5, and 15 min. D, determination of internalized biotin-labeled FLAG-mGluR1a lacking the PPIγ binding site (FLAG-PP1Ala) in HEK 293 cells transfected with 2 μg of pcDNA3.1 encoding FLAG-PP1Ala along with 2 μg of plasmid cDNA encoding either GFP or GFP-spinophilin following treatment with 30 μm quisqualate for 0, 5, and 15 min. E, determination of internalized biotin-labeled FLAG-mGluR1a lacking the PDZ binding motif (FLAG-ΔPDZ) in HEK 293 cells transfected with 2 μg of pcDNA3.1 encoding FLAG-ΔPDZ along with 2 μg of plasmid cDNA encoding either GFP or GFP-spinophilin following treatment with 30 μm quisqualate for 0, 5, and 15 min. The bar graphs represent the densitometric analysis of internalized biotin-labeled mGluR1a protein normalized to total cell surface mGluR1a biotinylation. Data represent the mean ± S.D. (error bars) of 4–6 independent experiments. *, p < 0.05 versus GFP-transfected cells.

