FIGURE 7.
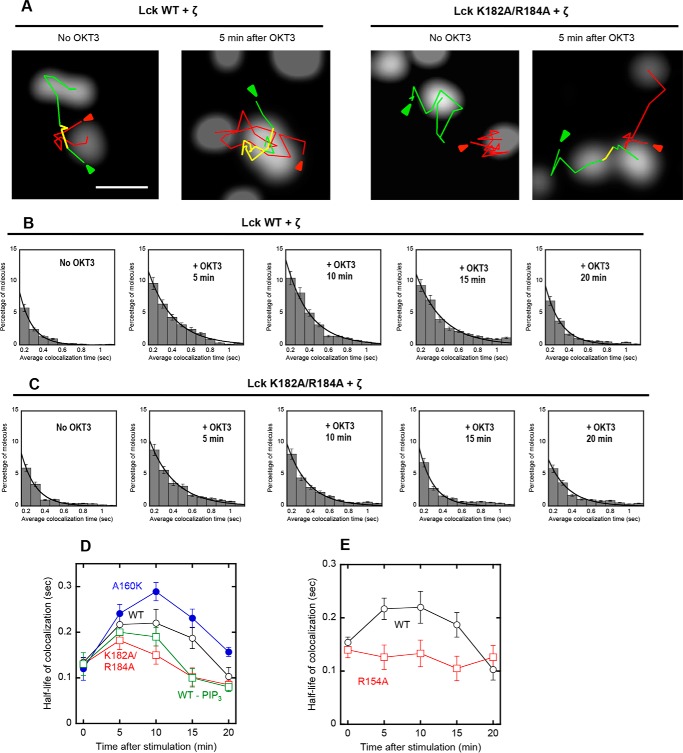
Single molecule tracking of Lck and TCR-ζ in the TCR complex. A, representative images of Lck-GFP (WT and K182A/R184A) and SNAP-TMR-labeled TCR-ζ in a JCaM1.6 cell before and after OKT3 stimulation are shown. Green, red, and yellow lines are trajectories of Lck, TCR-ζ, and colocalized molecules, respectively. Arrows indicate the starting points of tracking. The scale bar indicates 1 μm. B and C, time courses of dynamic colocalization of SNAP-TMR-TCR-ζ and Lck-GFP (WT and K182A/R184A). The histograms display percentages of TCR-ζ molecules spending a given colocalization time (>0.2 s) with Lck on the PM of JCaM1.6 cells. D and E, time courses of the half-life of colocalization for Lck-GFP proteins and SNAP-TMR-TCR-ζ. The half-life of colocalization was calculated from the dissociation rate constant (k), which was determined by non-linear least squares analysis of histograms using a single-exponential decay equation (i.e. P = Po e−kt). The same size of PM surface was analyzed for each histogram. Error bars indicate S.D. (n = 50–100).

