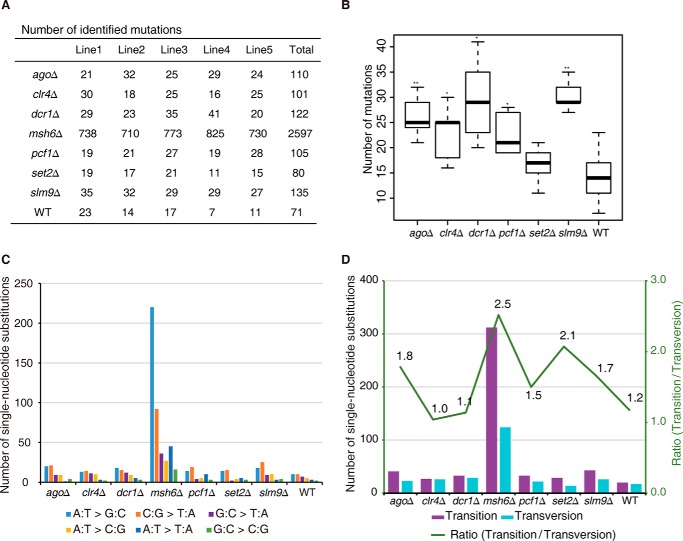
FIGURE 3.
Summary of mutation characteristics in experimental evolution. A, summary of quantity of mutations identified in all samples. B, box plots of the numbers of mutations in the listed strains. p values were calculated using the Wilcoxon Mann-Whitney test (*, p < 0.05; **, p < 0.01). Median, middle bar inside each box; box, first and third quartiles; whiskers, most extreme values within 1.5 times inter-quartile range from the box. C, summary of single-nucleotide substitution types in the listed strains. D, the number of transitions and transversions identified in each strain.

