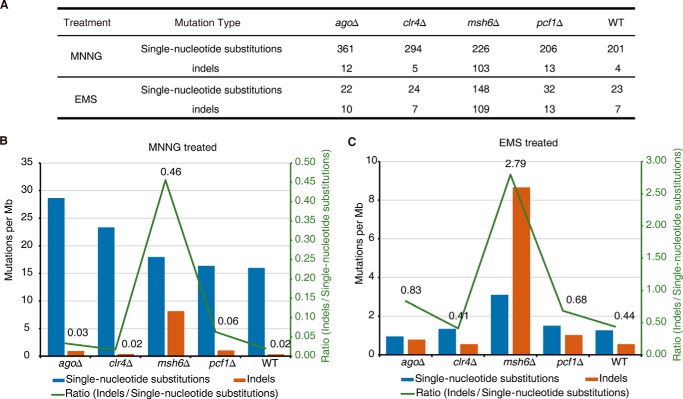
FIGURE 5.
Chemically induced mutation accumulation. A, summary of the mutations in the MNNG- and EMS-treated strains. Each background contained five replicates, and mutations were combined for calculations. B, mutation rate for single-nucleotide substitutions (blue) and indels (orange) in MNNG-treated strains. The green line represents the ratio of indels/single-nucleotide substitutions. C, mutation rate for single-nucleotide substitutions (blue) and indels (orange) in EMS-treated strains. The green line represents the ratio of indels/single-nucleotide substitutions.

