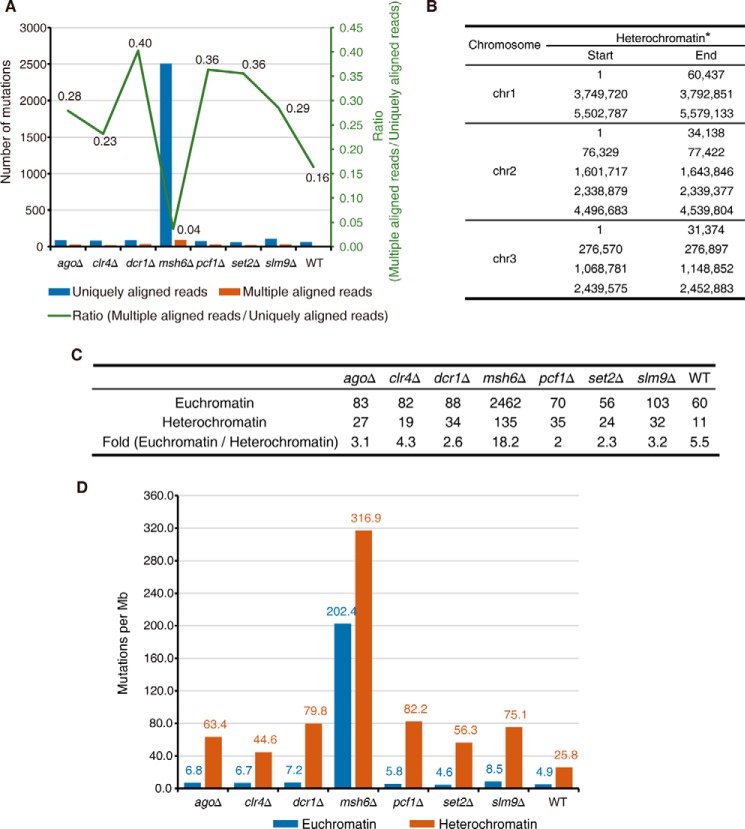
FIGURE 6.
The mismatch repair-deficient strain displayed a preferentially elevated rate of mutations in euchromatin. A, number of mutations identified at uniquely (blue) and multiple (orange) aligned reads in the listed strains. The green line represents the ratio of mutations at multiple/uniquely aligned reads. B, genomic distribution of heterochromatin regions defined using H3K9me2 ChIP-seq data. *, heterochromatin at mating type regions is excluded for analysis in this study, because the reference genome of S. pombe is that of an h+ strain that lacks the region between mat2 and mat3. C, summary of the number of mutations in heterochromatin and euchromatin of listed strains. D, mutation rate in euchromatin (blue) and heterochromatin (orange) regions in the listed strains.

