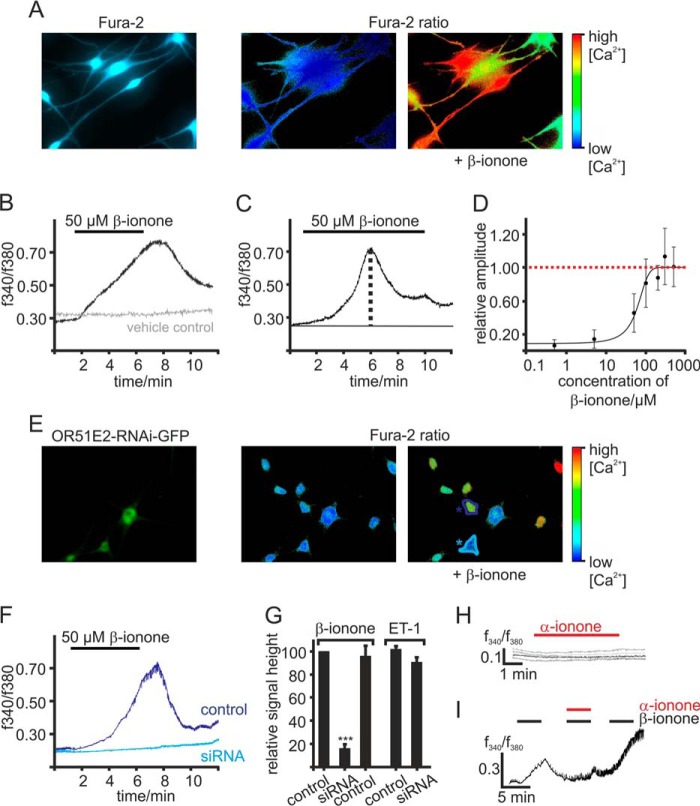
FIGURE 3.
OR51E2 activation induces a Ca2+ signal. A, representative picture of Fura-2-loaded melanocytes. Intracellular Ca2+ levels are indicated in pseudocolors, and images of changes in cytosolic Ca2+ were captured during a representative experiment. B, representative Ca2+ imaging trace of a melanocyte. In a randomly selected field of view, β-ionone (50 μm) application induced a transient, slow rise in intracellular Ca2+ (black) in individual cells. The gray Ca2+ imaging trace is representative for the vehicle controls (0.1% DMSO). Application of the solvent did not result in any changes in cytosolic Ca2+. Cytosolic Ca2+ levels were monitored as integrated f340/f380 fluorescence ratio expressed as a function of time. C, in prolonged stimulation the maximal signal amplitude was reached after a 5-min application of β-ionone. After reaching the maximum peak, the cytosolic Ca2+ concentration decreases until a plateau phase was sustained. β-Ionone was applied for 9 min. D, β-ionone induced Ca2+ increase is dose-dependent. β-ionone was applied for 9 min at different concentrations to ensure maximal signal amplitude generation. Signal amplitude was quantified, normalized to the maximal peak height, and is displayed as a function of the applied β-ionone concentration (n = 49–129 cells). E, Ca2+ imaging on primary melanocytes transfected with a plasmid encoding for siRNA directed against OR51E2. As the plasmid encodes for GFP under the same promoter, siRNA-expressing cells can be identified via GFP fluorescence (left panel); pseudocolor images were captured of Fura-2 loaded cells during Ca2+ imaging experiment (right panel). OR51E2-siRNA/GFP-expressing melanocytes (turquoise labeling) showed no significant changes in the Fura-2 ratio upon application of β-ionone, whereas non-transfected cells (blue labeling) did. F, β-ionone-induced Ca2+ signals in siRNA transfected (turquoise labeling) and control melanocytes (blue labeling) displayed as a function of time. 50 μm β-ionone was applied for 5 min. G, quantification of the relative signal amplitudes of the β-ionone evoked Ca2+ signals, normalized to the β-ionone response of control cells (n = 109 cells). n = 4 independent transfections were analyzed. Shown are OR51E2-siRNA-expressing melanocytes (n = 42 siRNA-expressing cells) and melanocytes transfected with a plasmid encoding for scrambled OR51E2-siRNA (control siRNA, n = 27). OR51E2-siRNA-transfected (n = 23) and control cells (n = 64) were stimulated with 40 nm endothelin-1 (ET-1) to control that siRNA expression did not affect cell viability. Error bars represent the S.E. Significance was calculated by Student's t test for each sample group referring to the signal amplitude in control melanocytes (***, p < 0.001). H, representative Ca2+ imaging traces of Fura-2-loaded melanocytes. α-Ionone (250 μm) was applied for 5 min. Cytosolic Ca2+ levels were monitored as integrated f340/f380 fluorescence ratio expressed as a function of time. I, co-application of the OR51E2-specific inhibitor α-ionone reduced the β-ionone-induced Ca2+ signals (n = 48). β-Ionone (50 μm) and the α-ionone and β-ionone 2:1 mix (100 μm and 50 μm, respectively) were applied for 4 min.

