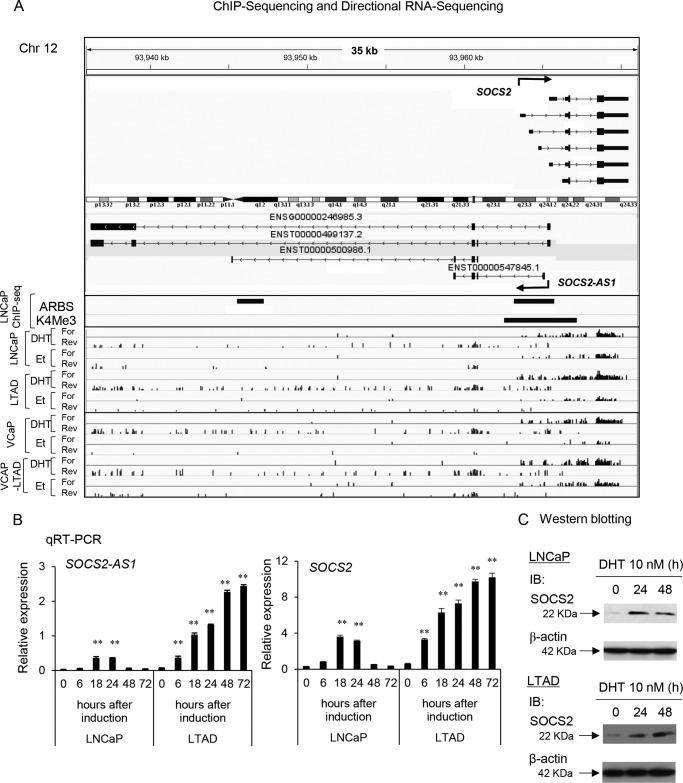
FIGURE 2.
SOCS2-AS1 is induced by androgen in LNCAP cells and is highly expressed in castration-resistant prostate cancer model LTAD cells. A, RNA-seq and ChIP-seq analysis of SOCS2-AS1 and SOCS2 in LNCaP and VCaP cell lines treated with 10 nm DHT or ethanol (Et) for 24 h. B, time course analysis of SOCS2-AS1 and SOCS2 mRNA after DHT treatment in LNCaP and LTAD cell lines determined by qRT-PCR. C, Western blotting analysis of SOCS2 after 10 nm DHT treatment at indicated time points. β-Actin was used as an internal control. IB, immunoblot. Values represent mean ± S.D.; **, p < 0.01.

