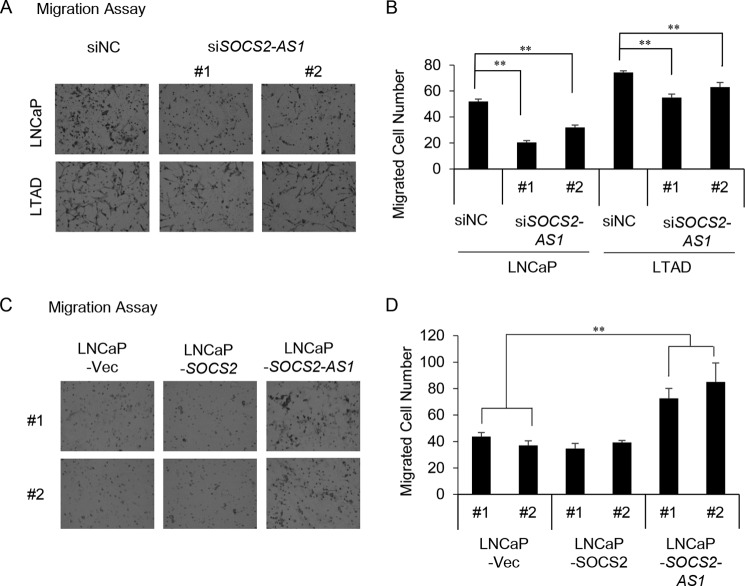
FIGURE 6.
SOCS2-AS1 overexpression enhances cell migration. A, migration assay of siSOCS2-AS1 (#1 and #2) and control siRNA-transfected cells in 10 nm DHT medium. B, quantification of migrated cells. Five random fields were counted using a microscope, and the average number of cells per field was calculated. C, migration assay of SOCS2 (#1 and #2), SOCS2-AS1 (#1 and #2) and control (#1 and #2) stable cells. D, quantification of migrated cells. Four random fields were counted using a microscope, and the average number of cells per field was calculated. Data represent the average of four different views. Vec, vector. Values represent mean ± S.D. **, p < 0.01.

