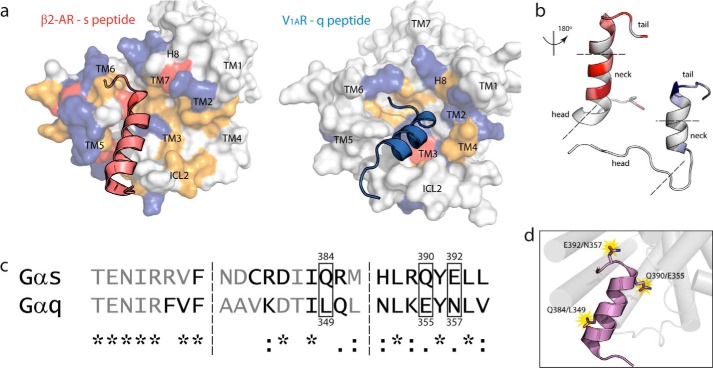
FIGURE 3.
Electrostatic, energetic, and structural differences in GPCR/peptide interface identify three hot spots for binding. a, intracellular view of β2-AR·s peptide complex (left) and V1AR·q peptide complex (right) showing surface representation of the receptor's binding interface coupled with cognate peptide. Charged residues are colored as follows: anionic (red), cationic (blue), non-charged polar (yellow), and hydrophobic (white). b, colored gradation indicating distribution of energetically favored (white to color: unfavorable to favorable) residue positions in s (left) and q (right) peptides based on simulation with cognate receptors. Peptides are rotated 180° about their principal axis to display GPCR contacting interface. Head, neck, and tail regions of C termini are denoted between dashed lines. c, structure-based sequence alignment of Gαs and Gαq C termini depicts residues binding to receptor (black) and residues left out of interface (gray). Residue similarity denoted as follows: identical (*); conservative, maintenance of charges (:); semi-conservative, replacement of charges (.); non-synonymous, changed chemical properties (no symbol). d, hot spot residues conferring specificity of Gαs binding to β2-AR and Gαq binding to V1AR.

