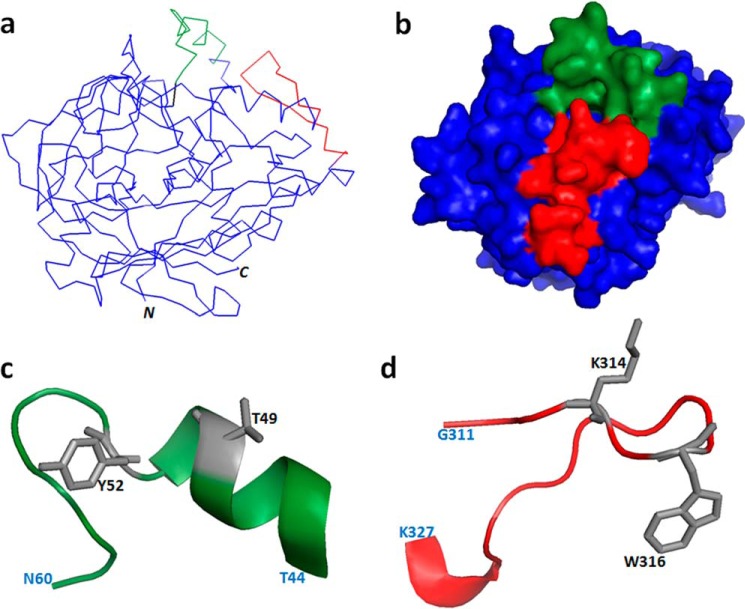
FIGURE 4.
Mapping of IgE epitope. IgE-reactive peptides P1 (green) and P5 (red) mapped on Rhi o 1 homology model (blue) represented as α-carbon backbone structure (a) and space-filled model (b). Shown are enlarged schematic representations of the conformation of P1 (c) and P5 (d) on a Rhi o 1 three-dimensional model. Critical residues (gray side chains) and terminal residues (light blue) are labeled.

