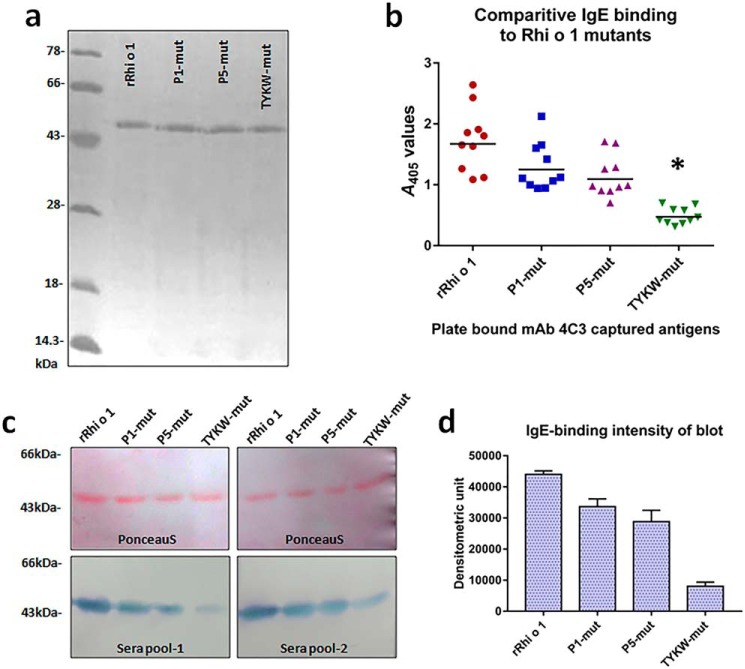
FIGURE 6.
IgE reactivity of Rhi o 1 mutants. a, purified rRhi o 1 and its mutants in silver-stained 12% SDS-PAGE. b, scatter plot showing reactivity of mAb4C3-captured Rhi o 1 and its mutants (x axis) to IgE antibody (A values; y axis) from patients' sera (n = 10) in sandwich ELISA. Horizontal bars, geometric means of A values against each antigen. *, p < 0.001 (i.e. significant difference in IgE binding to TYKW-mut versus WT rRhi o 1). c, top, confirmation of equal loading (2 μg) of rRhi o 1 and its mutants on PVDF membrane by Ponceau S staining followed by IgE immunoblotting (bottom) with two sera pools. d, comparison of IgE-reactive band intensity (mean of densitometric units ± S.D. (error bars); y axis) of rRhi o 1 and mutants (x axis) in immunoblots with patients' sera pools (n = 2).

