Figure 2.

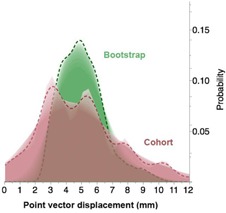
Shadowgram showing the difference in distribution probability of points of interest vector displacement over treatment time between the studied cohort and its bootstrap resampling.

Shadowgram showing the difference in distribution probability of points of interest vector displacement over treatment time between the studied cohort and its bootstrap resampling.