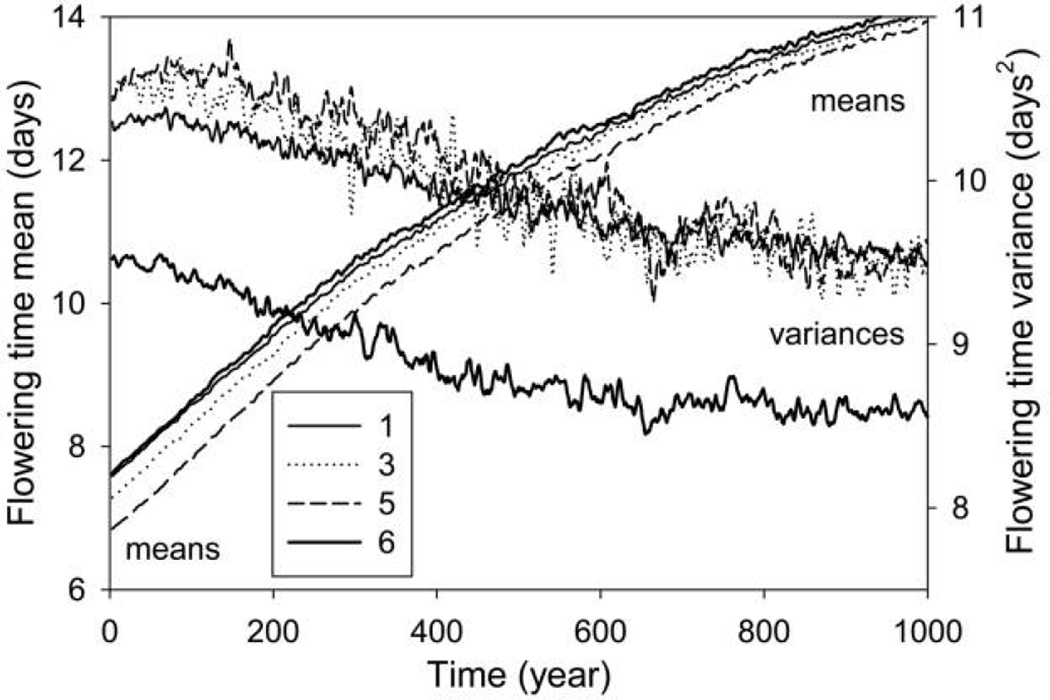
Figure 3.
Stage-specific phenotypic means and variances for flowering time in stages 1, 3, 5, and 6 (indicated by the key) from the IBM (individual-based model) for h2 = 0.5 (averages over 100 runs). For clarity, values have been smoothed using a 5-year moving average, and stages 2 (similar to stage 1) and 4 (similar to 5) have been omitted. The bold lines are for stage 6.

