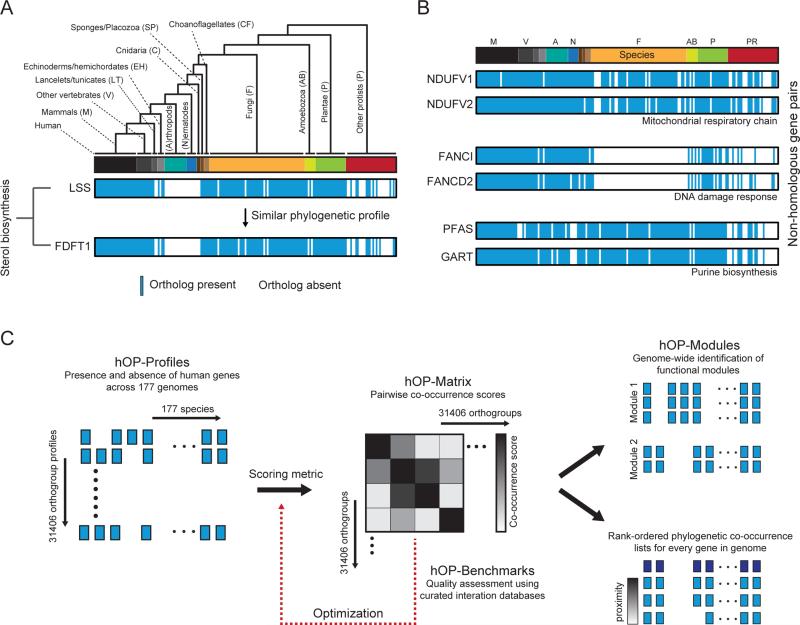
Figure 1. Strategy for human-centric phylogenetic profiling.
(A) LSS ortholog distribution collapsed into binary phylogenetic vector in accordance with the branching structure of the tree (Figure S1 and Experimental Procedures); vector contains 177 elements with 1 (blue, present) or 0 (white) absent. Individual species are represented with a bar colored according to membership in 13 different branches. The lower profile represents the gene FDFT1, a member of the same cholesterol biosynthetic pathway as LSS. (B) Additional examples of functionally linked gene pairs with correlated phylogenetic profiles. Genes have no detectable homology to each other (BLASTp). The linear ordering of species is represented with a color bar as in (A) with abbreviated labels and without the accompanying species tree, a concise form used in subsequent figures. (C) Schematic illustrating overall workflow for the hOPMAP algorithm. See also Figure S1.

