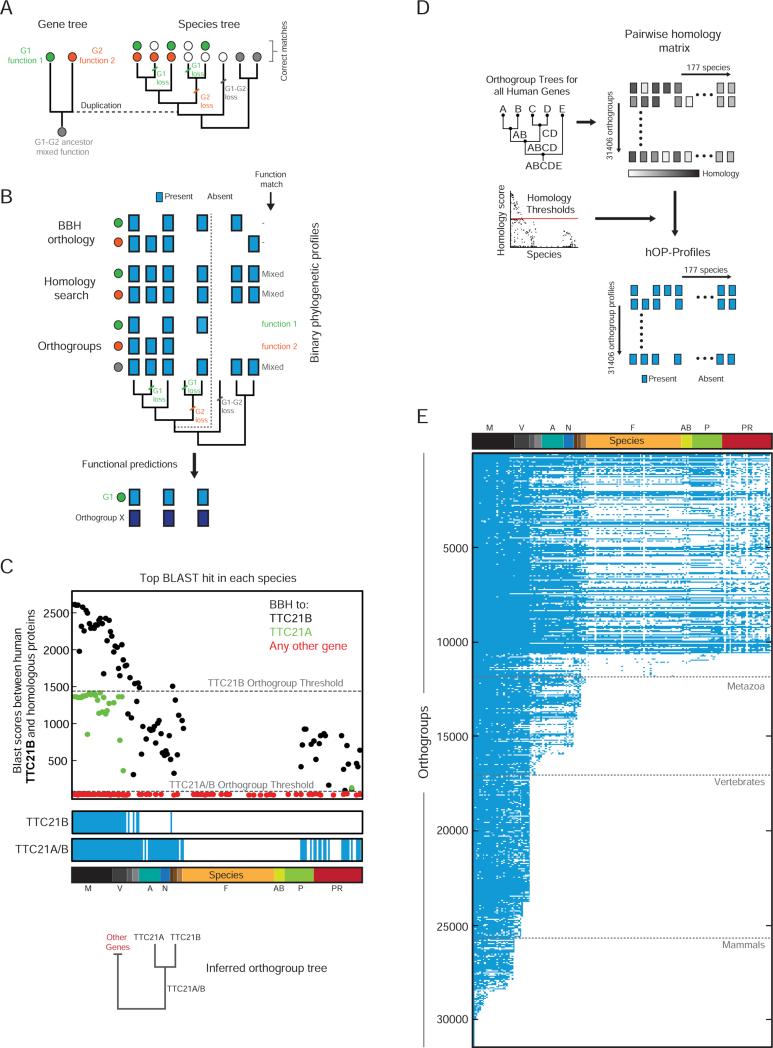
Figure 2. Binary eukaryotic phylogenetic profiles for 31406 human orthogroups.
(A) Schematic to demonstrate the impact of human gene history on the distribution of ortholog functions across species. Genes are represented by filled circles with colors denoting independent functional trajectories. The duplication event is highlighted using a dotted line. (B) A comparison of three different approaches to generating phylogenetic profiles (blue box=present, white box=absent) for the gene family and species tree from (A). The specific functional predictions that each profile can generate are listed to the right. BBH=Best Bidirectional Hit. Dark blue is used to denote a separate phylogenetic profile (Gene X) identified through a similarity search. (C) The top BLAST hit against human TTC21B in each species colored according to a BBH match for the corresponding protein against TTC21B (black), TTC21A (green), or any other human gene (red). Gray lines highlight inferred orthogroup thresholds. Below, resulting phylogenetic profiles (blue/white) and inferred orthogroup tree. See also Figure S2. (D) Extension of algorithm to entire genome. (E) The full hOP-map, containing binary phylogenetic profiles for 31406 orthogroups, listed in decreasing order of estimated first appearance (see Experimental Procedures). Gray lines denote key branch points. See also Figure S2.

