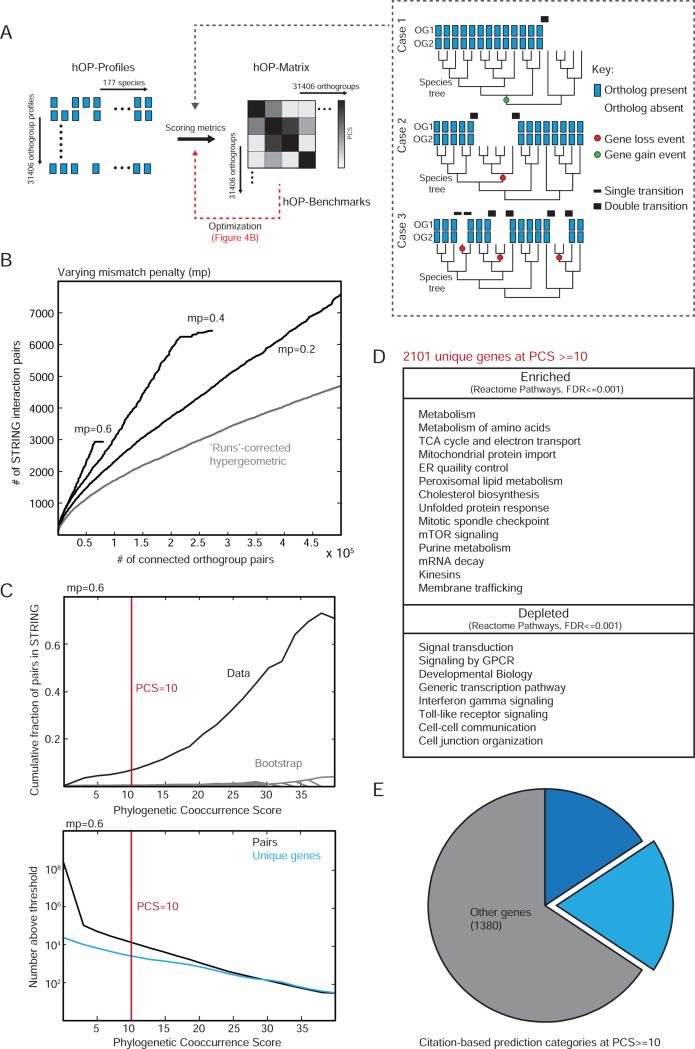
Figure 3. Generating a genome-wide phylogenetic co-occurrence matrix.
(A) Schematic for generating a genome-wide pairwise co-occurrence matrix for human orthogroups. The inset highlights 3 pairs of hypothetical orthogroups indistinguishable if independence of species is assumed. However the profiles in case 1 and 2 can be reconciled with likely models of a single gain event (green dot) and a single loss event (red dot) respectively while case 3 involves 3 independent loss events. We used weighted transitions (black bars of varying thickness) to construct the phylogenetic co-occurrence score (PCS, see Experimental Procedures). (B) The PCS was benchmarked against STRING (Experimental Procedures). A range of mismatch penalty (mp) values were compared to each other and the original ‘runs’ algorithm (Cokus et al. 2007) (C) The upper panel shows the cumulative fraction of co-evolving pairs confirmed by STRING for each PCS threshold (black) compared to a random bootstrap (gray), with the lower panel showing the total number of pairs at each corresponding threshold value, at mp=0.6. Red line indicates the threshold used for further analysis. (D) Table highlighting a selected list of enriched and depleted functional terms at PCS >=10 (Experimental Procedures). (E) All genes contained in orthogroups involved in interactions with PCS>=10 were grouped into 3 categories (both poorly studied, citation count <3; one poorly studied, citation count <3 for gene 1 and >10 for gene 2; all other genes; see Supplemental Experimental Procedures for further details). See also Figure S3.

