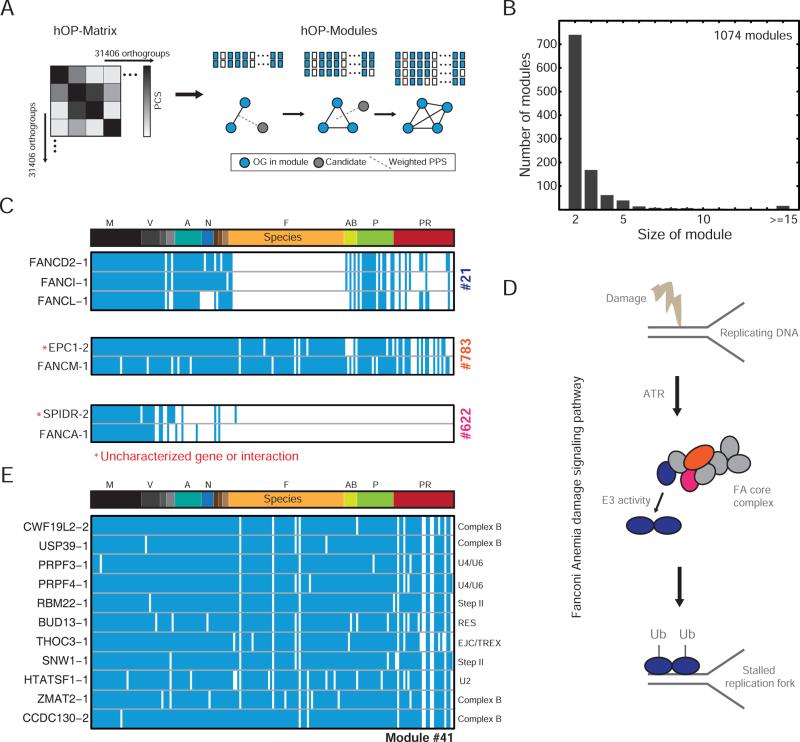
Figure 4. Unbiased clustering of human genes into co-evolving modules.
(A) Schematic illustrating the module expansion strategy (see Experimental Procedures). (B) Histogram representing the final sizes of 1074 modules. (C) Modules linked to the Fanconi Anemia (FA) pathway. Red stars indicate predicted interactions. (D) Schematic illustrating aspects of the FA pathway with genes in hOP-modules color-coded according to (C). (E) Module linked to splicing, with each orthogroup annotated to specific splicing complexes. See also Figure S4.

