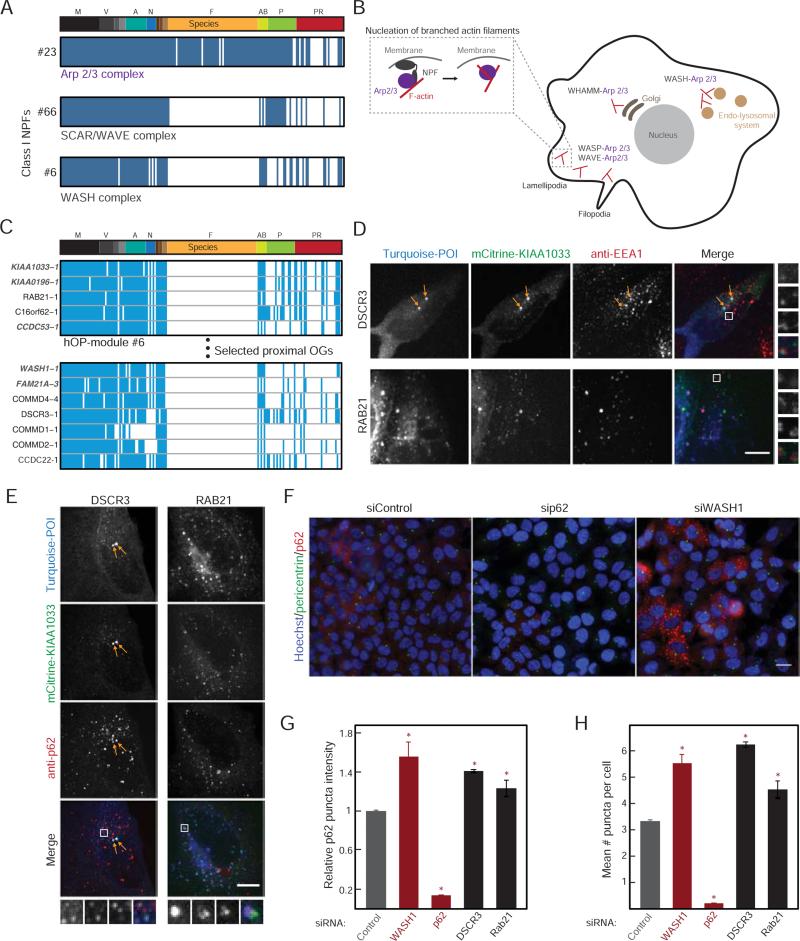
Figure 6. Investigation of genes with a predicted link to WASH complex function.
(A) Consensus profiles for the Arp2/3 complex, SCAR/WAVE complex and WASH complex (module ID on the left). (B) Schematic highlighting the role of branched actin in various cellular locations and specificity provided by the different Class I NPFs, with inset showing recruitment of Arp2/3 followed by nucleation of a new branch. (C) hOP-profiles from module #6 and extended neighborhood (Supplemental Experimental Procedures) containing WASH complex components (gray) and candidates (red stars). (D), (E) mTurquoise-tagged DSCR3 or RAB21 (blue in merge) were co-expressed with mCitrine-tagged KIAA1033 (green in merge) in HeLa cells also immunostained with an antibody to EEA1 (D, red in merge) or p62 (E, red in merge) and imaged at 63X on a confocal microscope. Images are maximum intensity projections. In the DSCR3 images, arrows highlight characteristic bright co-localizing EEA1-negative foci. In both cases, white boxes represent magnified regions on right and bottom. Scale bar=10 μm. (F) HeLa cells treated with siRNA for 48 hours were subjected to acute stress (10 μM Bortezomib for 30 minutes), and immunostained for pericentrin (green) and p62 (red) and labeled with Hoechst (blue) to mark nuclei. Sample images from 3 treatment conditions obtained at 20X are shown. Scale bar=20 μm. (G) Mean p62 puncta intensity per cell (Supplemental Experimental Procedures) for each condition. Bars represent the mean and standard deviation of two replicates with >1000 cells per replicate from a single experiment (experiments could not be pooled due to the variable fraction of control cells expressing p62, but trends were reproducible across >3 independent experiments). Red stars mark a significant deviation from control (p-value<0.05, estimated using multiple pairwise comparison after one-way ANOVA). (H) The average number of puncta per cell, analyzed as in (G). See also Figure S5.

