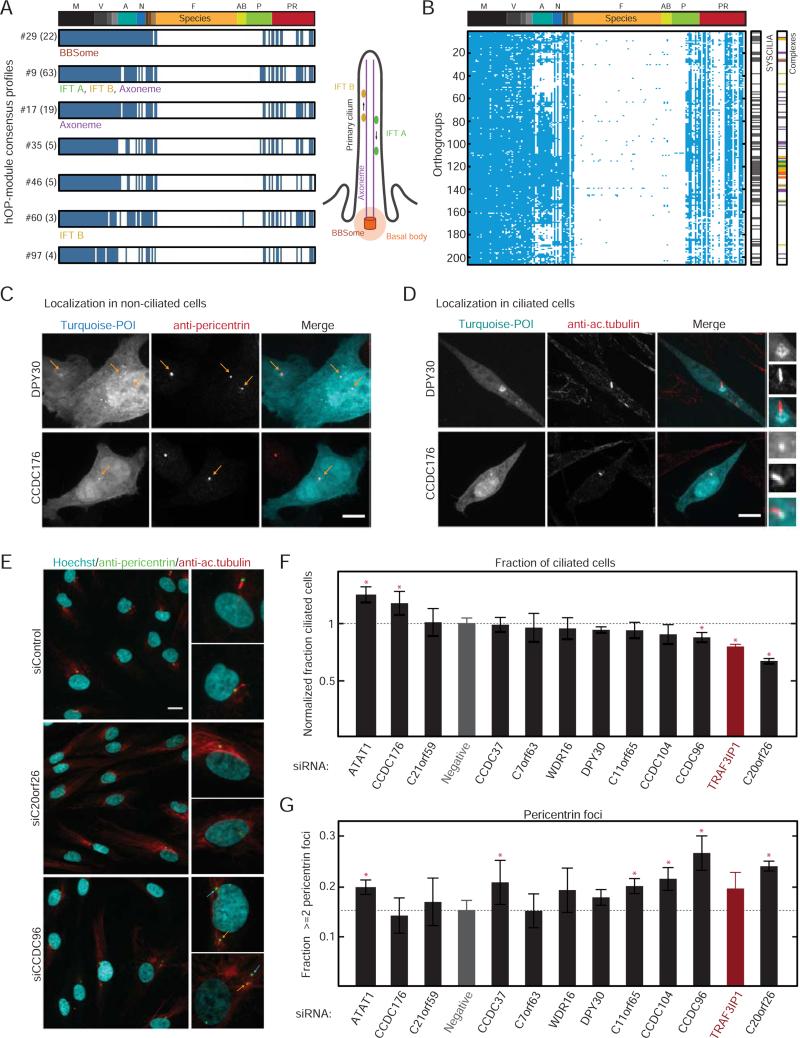
Figure 7. Investigation of genes with a predicted role in cilia/basal body function.
(A) Consensus profiles for hOP-modules (labels: #ID (no. of orthogroups)) enriched for genes involved in CBB function. (B) Ciliome (206 hOP-profiles) identified through module expansion (Experimental Procedures). “SYSCILIA” and “Complexes” bars indicate overlap with respective lists. (C) Localization of transiently expressed candidate proteins (tagged with mTurquoise, cyan in merge) at centrosomes (antibody to pericentrin, red in merge) in HeLa cells. Yellow arrows highlight locations of centrosomal foci. Scale bar=10 μm. Images are maximum intensity projections of confocal stacks acquired at 63X. (D) Localization of the same candidates (cyan) in NIH3T3 cells with primary cilia marked by an antibody to acetylated tubulin (red), Boxes highlight ciliary region, zoom to the right. Imaged as in (C). Scale bar=10 μm. (E) Serum-starved Hs68 cells subjected to 60 hours of siRNA treatment were stained with Hoechst (cyan in merge) and labeled with pericentrin (green) and acetylated tubulin antibodies (red), followed by wide-field imaging at 20X. Boxes correspond to zoom on right. Yellow arrows highlight centrosome with associated cilium, blue arrows highlight additional centrosomal foci. Scale bar=20 μm. (F) The normalized fraction of cells with a detectable cilium following siRNA treatment, averaged over 4 replicates pooled from multiple experiments for each condition with >1000 cells per replicate (Experimental Procedures); scrambled siRNA (“Negative”) in gray, positive control TRAF3IP1 in red. Red stars highlight significant difference from negative control (p-value <0.05, multiple pairwise comparison following one-way ANOVA) (G) The fraction of cells with 2 or more detectable pericentrin foci, averaged, ordered and assessed for significance as in (F). See also Figure S6.

